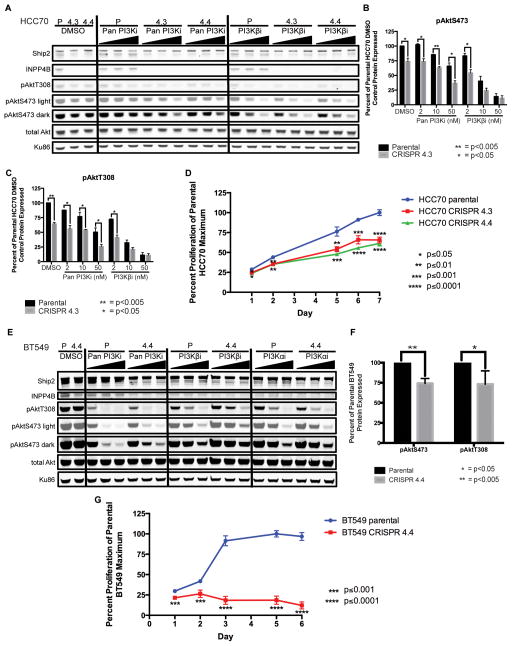
Figure 3. Effect of CRISPR-mediated knockout of INPP4B in HCC70 and BT549 cell lines on Akt signaling and rates of cell proliferation.
A, parental HCC70 (P), HCC70 CRISPR 4.3 (4.3) and HCC70 CRISPR 4.4 (4.4) cells treated with DMSO, three increasing concentrations of Pan PI3Ki or three increasing doses of PI3K-βi. B–C, quantification of pAktS473 (B) and pAktT308 (C) signal normalized to total Akt then to the DMSO-treated parental HCC70 cell line, and plotted as pair-wise comparisons between parental HCC70 cells and HCC70 CRISPR 4.3 cells; * and ** indicate p<0.05 and p<0.005, respectively, for unpaired two-tailed t tests between parental HCC70 cells and HCC70 CRISPR 4.3 cells at each inhibitor concentration. Data represent the average of two experiments. D, parental HCC70, HCC70 CRISPR 4.3 and HCC70 CRISPR 4.4 cell line proliferation over 7 days, plotted as a percent of the parental HCC70 cell line maximum growth; *, **, *** and **** indicate p≤0.05, p≤0.01, p≤0.001 and p≤0.0001, respectively, for unpaired two-tailed t tests between the parental HCC70 cell line and either the HCC70 CRISPR 4.3 cell line (above red line) or the HCC70 CRISPR 4.4 cell line (below green line) on each day measurements were taken. Each day represents the mean of sextuplicate readings (six wells). E, parental BT549 (P) and BT549 CRISPR 4.4 (4.4) cells treated with DMSO, three increasing concentrations of Pan PI3Ki, three increasing doses of PI3K-βi or three increasing doses of PI3K-αi. F, quantification of pAktS473 and pAktT308 signal normalized to total Akt and then to the DMSO-treated parental BT549 cell line, plotted as pair-wise comparisons between parental BT549 cells and BT549 CRISPR 4.4 cells; * and ** indicate p<0.05 and p<0.005, respectively, for unpaired two-tailed t tests between the parental BT549 cell line and the BT549 CRISPR 4.4 cell line. Data represent the average of two experiments. G, parental BT549 and BT549 CRISPR 4.4 cell line proliferation over 6 days, plotted as a percent of the BT549 parental cell line maximum growth; *** and **** indicate p≤0.001 and p≤0.0001, respectively, for unpaired two-tailed t tests between the parental BT549 cell line and BT549 CRISPR 4.4 cell line (below red line) on each day measurements were taken. Each day represents the mean of sextuplicate readings (six wells). (Pan PI3Ki: GDC-0941, PI3K-αi: BYL719, PI3K-βi: AZD6482; par = parental)

