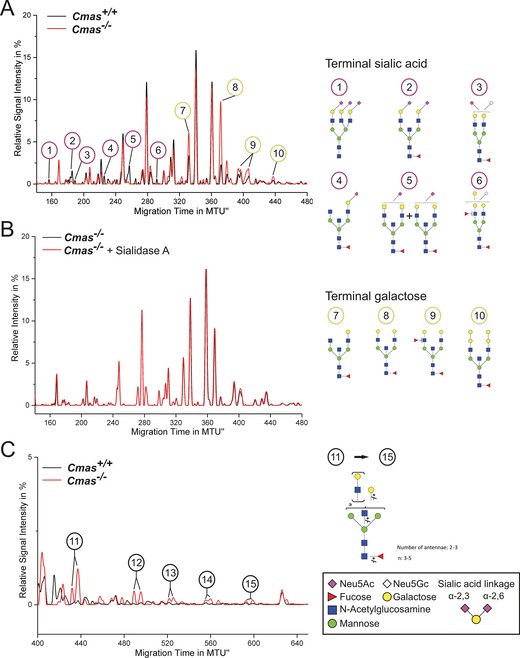
Figure 3.

Loss of CMAS activity in mESCs entails increased exposure of galactose and oligo‐LacNAc residues at the cell surface. The y‐axis of normalised electropherogram is divided by the summed peak height of all quantifiable peaks (S/N≥9); relative signal intensity [%] of total peak height is plotted. A) and C) Differential xCGE‐LIF analysis of N‐glycans from undifferentiated Cmas +/+ and Cmas −/− mESCs: electropherogram regions from A) 140 to 480 normalised migration time units (MTU) and C) 400 to 650 MTU. B) Electropherogram of undifferentiated Cmas −/− mESCs before (black) and after sialidase treatment (red). N‐Glycan structures in xCGE‐LIF analyses are annotated: sialylated N‐glycans (1–6), galactose capped N‐ glycans (7–10) and oligo‐LAcNAc capped N‐glycans (11–15). Example N‐glycan structures 1 to 15 are depicted (right; detailed N‐glycan annotation in Figure S4). Activity and specificity of A. urefaciens sialidase was confirmed by treatment of bovine fetuin and subsequent xCGE‐LIF analysis of the well‐defined N‐glycans (Figure S3 A). Structures are presented following the Consortium for Functional Glycomics notation (www.functionalglycomics.org/glycomics/molecule/jsp/carbohydrate/carbMoleculeHome.jsp). Linkage positions of sialic acids are indicated by differing angles. All mESC lines were cultured feeder‐free with LIF supplementation to maintain the pluripotent state (Cmas +/+ n=3, Cmas +/− n=5, Cmas −/− n=4). Representative results from one cell line per genotype are shown.
