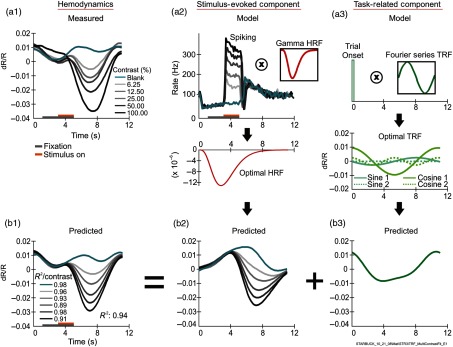
Fig. 1.
HRF+TRF model and optimal predictions compared with measured hemodynamics. (a1)–(a3) Measured responses and schematic of the model. (a1) The measured hemodynamic response (shown for an experiment with five stimulus contrasts and a blank) is proposed to be the sum of two components. The first component, the stimulus-evoked one (a2), is modeled as the measured spiking response per contrast [(a2), main panel], convolved () with a gamma-variate HRF kernel [(a2), inset]. The optimal HRF kernel after fitting is shown below (a2), with the corresponding prediction in (b2). The second component, the task-related one (b3), is modeled as the convolution of unit-amplitude delta functions at trial onsets [(b3), main panel] convolved with a Fourier series kernel [TRF: (a3) inset: illustrated here with just the fundamental sine term]. The optimal fitted TRF for a Fourier series model that includes the fundamental and the first harmonic is shown below (a3). It sums to the predicted task-related component shown in (b3). Note that although the period of the fundamental appears to match that of the trial, the model does not assume a match. Rather, it lets the fundamental be a variable fraction of the trial period. Thus, for this model, the set of optimized parameters comprises and the two pairs of cosine and sine Fourier coefficients and for the TRF, and the three parameters amplitude, time to peak, and peak width for the HRF [see Eqs. (1)–(3) in Sec. 2.3]. Also note, parenthetically, that the task-related component cannot simply be equated to the no-stimulus (blank-trial) response. All trials, including the blank, have a prominent trial-locked spiking response: reduced spiking as the animal fixates on the gray screen, increasing with a rebound at the end of fixation [(a2); also see supplementary Fig. 1 in Ref. 16). This trial-locked spiking would evoke trial-locked hemodynamics that is impossible to disambiguate from the trial-locked task-related component without a model such as the one here. (b1)–(b3) Optimal predictions. (b1) Optimal predicted hemodynamics. This is the sum of the optimal predicted stimulus-evoked component (b2) and the optimal predicted task-related component (b3). The of the prediction compared to the measured hemodynamics, contrast by contrast, and the mean averaged across contrasts are shown in (b1). Contrast is color coded, as shown in the key in (a1. Note: For this and all other figures, please see online version for color coding; print version only uses grayscale). All hemodynamic responses both measured and predicted are shown in units of fractional change in light reflected off the cortical surface (); this is proportional to local change in blood volume, with downward excursions indicating increased absorption of light and thus increased blood volume. All traces other than inset kernels are on a common time scale. (a1) and (a2) show the trial structure, i.e., the fixation and stimulus presentation periods on the time axis, color coded as in the key in (a1). The label below (b3) (“STARBUCK_…”) identifies the experiment. Similar labels are used in all figures to identify data sets.

