Figure 2.
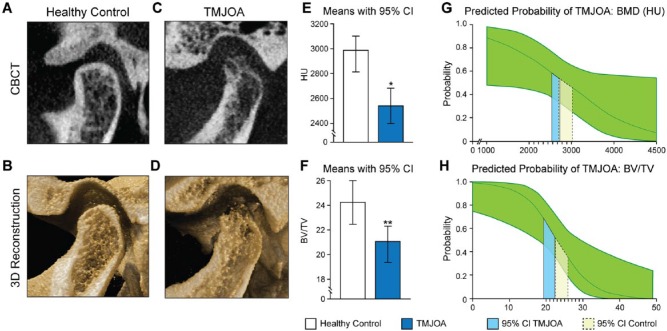
Representative images and bone quantification of healthy control and TMJOA. (A–D) The representative CBCT and 3D reconstruction images of healthy control (A and B) and TMJOA (C and D). Compared to the healthy control, the TMJOA images (C and D) show condylar head deformity, lower trabecular bone density, and thinner cortical bone. (E–F) The CT HU (E) and BV/TV (F) of TMJOA condyles were significantly lower than that of healthy condyles. (G–H) Predicted probabilities of TMJOA along the ranges of CT HU (G) and BV/TV (H) observed in the data, averaged over all other covariates and with the subject random effect fixed at zero. The green regions indicate the 95% confidence interval. The solid lines (blue) delineate the interval [mean – SD, mean + SD] for healthy control. The dashed lines (yellow) delineate the interval [mean – SD, mean + SD] for TMJOA. These intervals overlap for CT HU but not for BV/TV. TMJOA, temporomandibular joint osteoarthritis; CBCT, cone beam computed tomography; CT HU, computed tomography Hounsfield unit; BV/TV, bone volume fraction; SD, standard deviation. *P < 0.05. **P < 0.01. This figure is available in color online.

