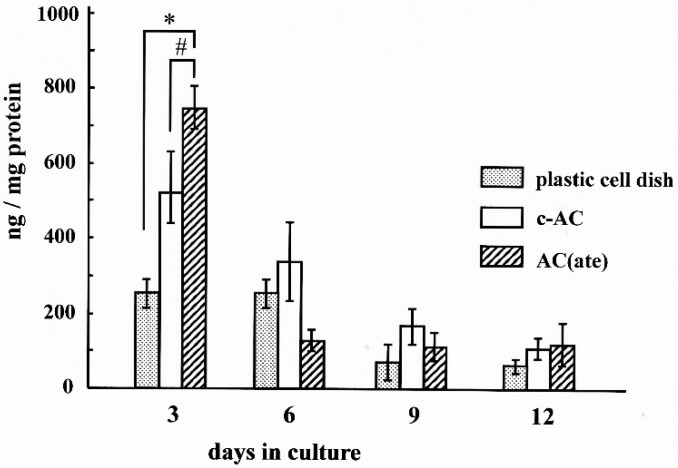
Figure 4.
Time course of the amount of procollagen type I carboxy-terminal peptide (PICP) produced by MC3T3-E1 cells in cultures with each type of specimen. Results are shown as the mean ± standard deviation (n = 5). * and # indicate a significant difference as compared to the plastic cell well and c-AC, respectively (Student’s t-test: p < 0.05).

