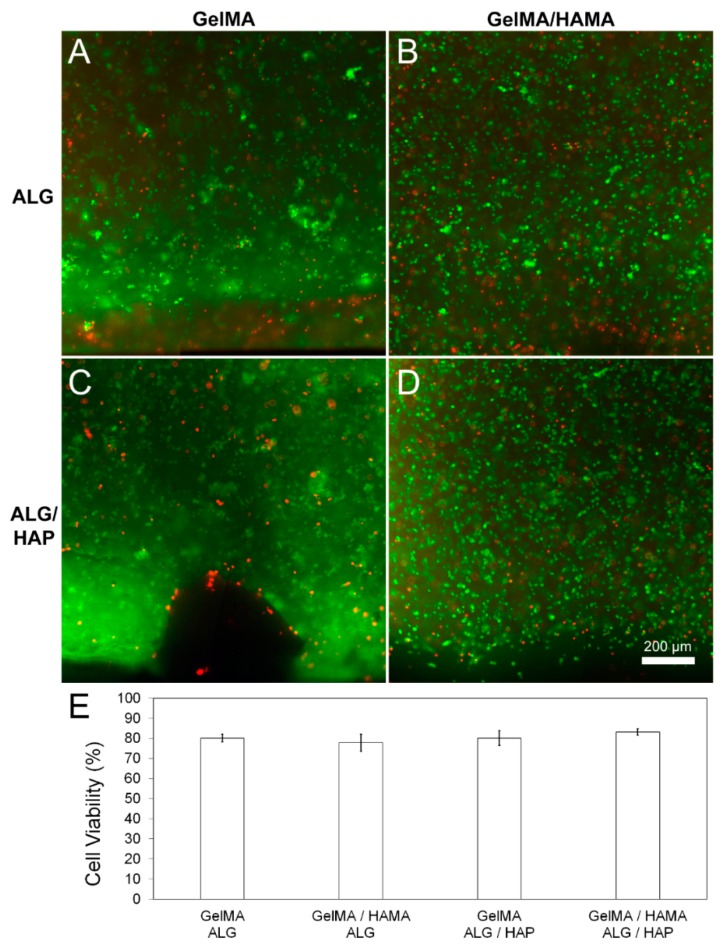
Figure 4.
Cell viability in hydrogel groups on day 1 of culture. Images and quantitated data of cell viability measured using FDA/PI assay on day 1 of culture. Quantification and image analysis was performed using ImageJ. (A): GelMA-ALG; (B): GelMA/HAMA-ALG; (C): GelMA/ALG-HAP; (D): GelMA-HAMA/ALG-HAP; (E): quantified viability from n = 3 samples per group. Scale bar 200 µm.

