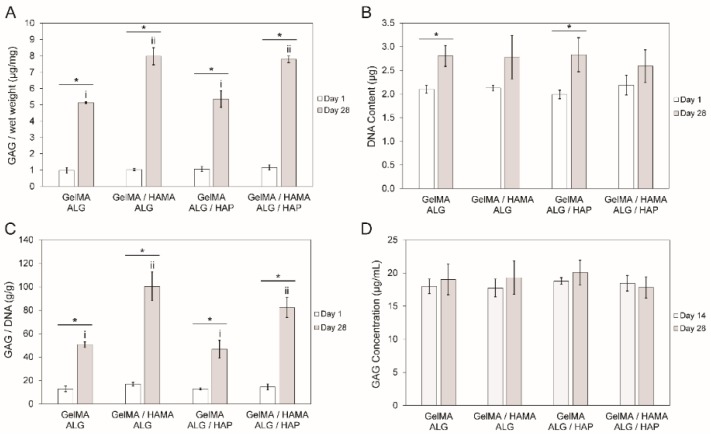
Figure 6.
DNA and GAG content in constructs over the culture period. (A): comparison of day 1 and day 28 results of GAG content (µg) per gel wet weight (mg); (B): DNA content (µg) per gel; (C): GAG content (g) per DNA content (g) in gels and (D): GAG concentration in media (µg·mL−1) on days 14 and 28 of culture. The four groups in each time point were compared separately to the second time point, with upper case Roman numerals used for day 1 and lower case for day 28. When groups share Roman numerals they are statistically similar. Bars with stars indicate t-test comparison results between one group across two time points. All groups have n = 3 samples. In all cases cell-free constructs were used to correct for any material-based content potentially interfering with the GAG measurements.

