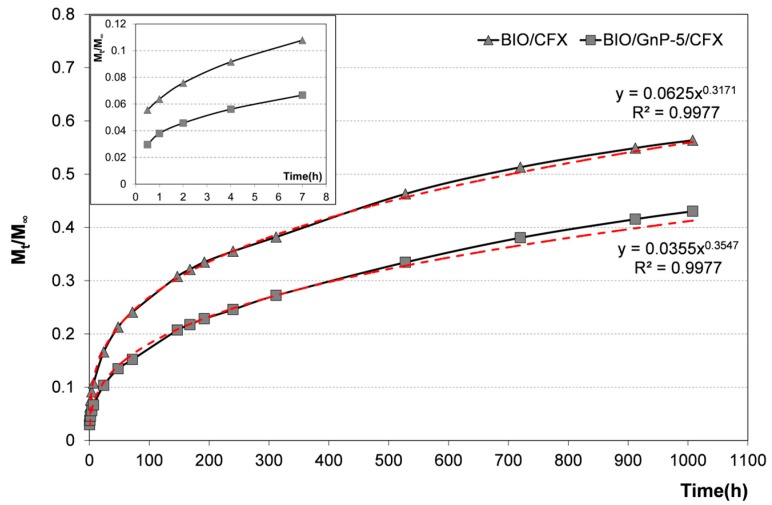
Figure 6.
Cumulative CFX release from BIO/CFX and BIO/GnP-5/CFX. In the inset, only the first hours of release are plotted in order to enhance their readability. The power trend-lines fitting the experimental data (red dashed lines) are reported in the graph together with the respective equations and the R2 values.

