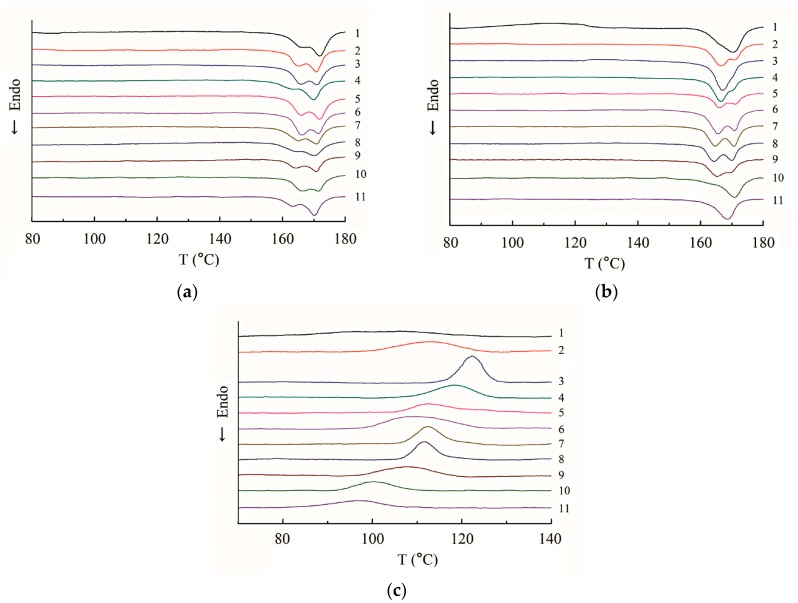
Figure 8.
Differential scanning calorimetry curves of isothermally crystallized samples. (1) PLA; (2) PLA/PF (90 wt %/10 wt %); (3) PLA/PF (80 wt %/20 wt %); (4) PLA/PF (70 wt %/30 wt %); (5) PLA/PF (60 wt %/40 wt %); (6) PLA/T-PF (90 wt %/10 wt %); (7) PLA/T-PF (80 wt %/20 wt %); (8) PLA/T-PF (70 wt %/30 wt %); (9) PLA/T-PF (60 wt %/40 wt %); (10) PLA/PBAT/T-PF (60 wt %/10 wt %/30 wt %); (11) PLA/PBAT/T-PF (50 wt %/20 wt %/30 wt %).

