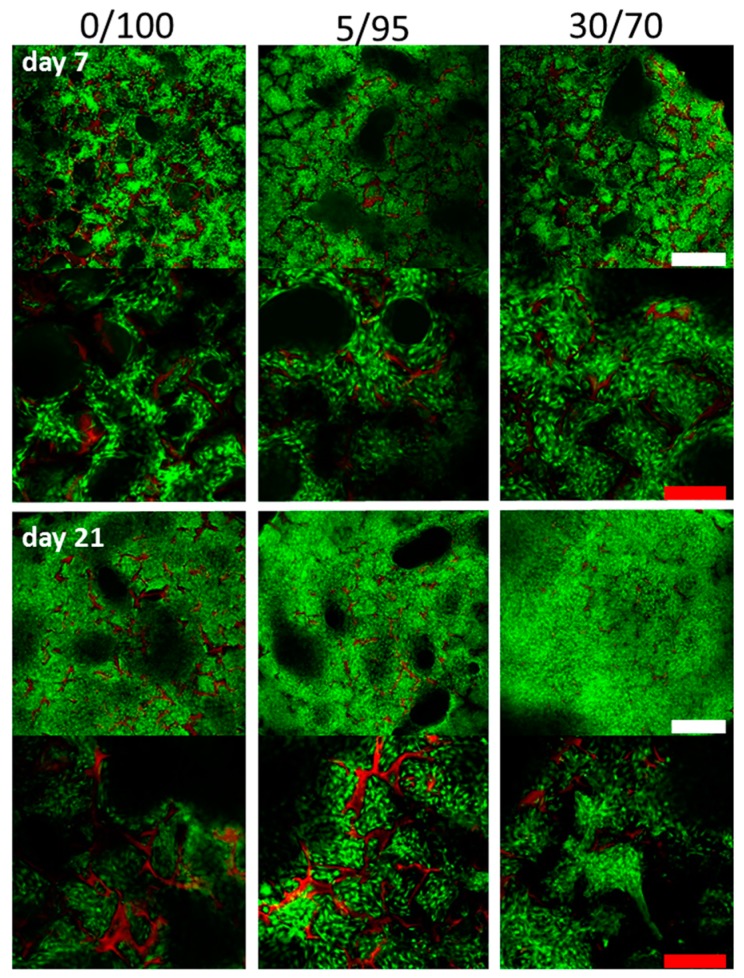
Figure 3.
Confocal imaging after Calcein staining at day 7 and day 21 after cell seeding (upper rows ×4 magnification, lower rows ×10 magnification) depicting three dimensional adhesion of cells in primary and secondary pores in the center of the scaffolds. Visually, no differences between adhesion patterns and cell densities are detected. Green = Calcein-labeled cells; red = scaffold. (White scale bars = 500 µm, red scale bars = 250 µm).

