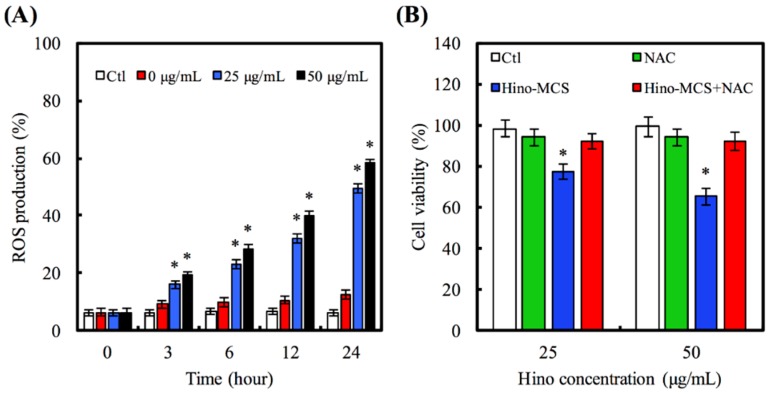
Figure 7.
(A) A549 cells in response to 25 and 50 μg/mL Hino-MCS nanoparticles for various time points and the ROS production. Star indicates a significant difference (p < 0.05) compared to 0 μg/mL; (B) For cell viability, A549 cells were exposed to 25 and 50 μg/mL Hino-MCS nanoparticles for 48 h before pretreated with or without NAC, respectively. Star indicates a significant difference (p < 0.05) compared to cell with pretreatment inhibitor.

