
Figure 2.
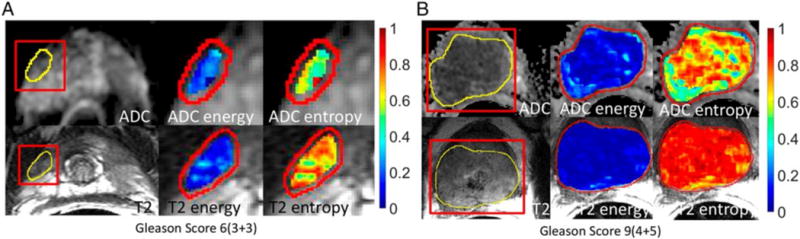
Example of texture analysis on ADC map and T2W image of prostate cancer. Energy and entropy values are overlaid on the tumour on ADC map (the top row) and T2W image (the bottom row). The texture features differ between a tumour of Gleason score (GS) 6 (3+3) (a) and a tumour of GS 9 (4+5) (b). Fehr et al.22 reported that texture analysis together with machine learning had distinguished GS6 (3+3) versus GS ≥7 and GS 7(3+4) versus GS (4+3) with high accuracy: 93% and 92%, respectively. Reprinted with permission from “Automatic classification of prostate cancer Gleason scores from multiparametric magnetic resonance images,” by Fehr et al.,22 Proc Natl Acad Sci U.S.A, 2015 Nov 17; 112(46):E6265-E6273.