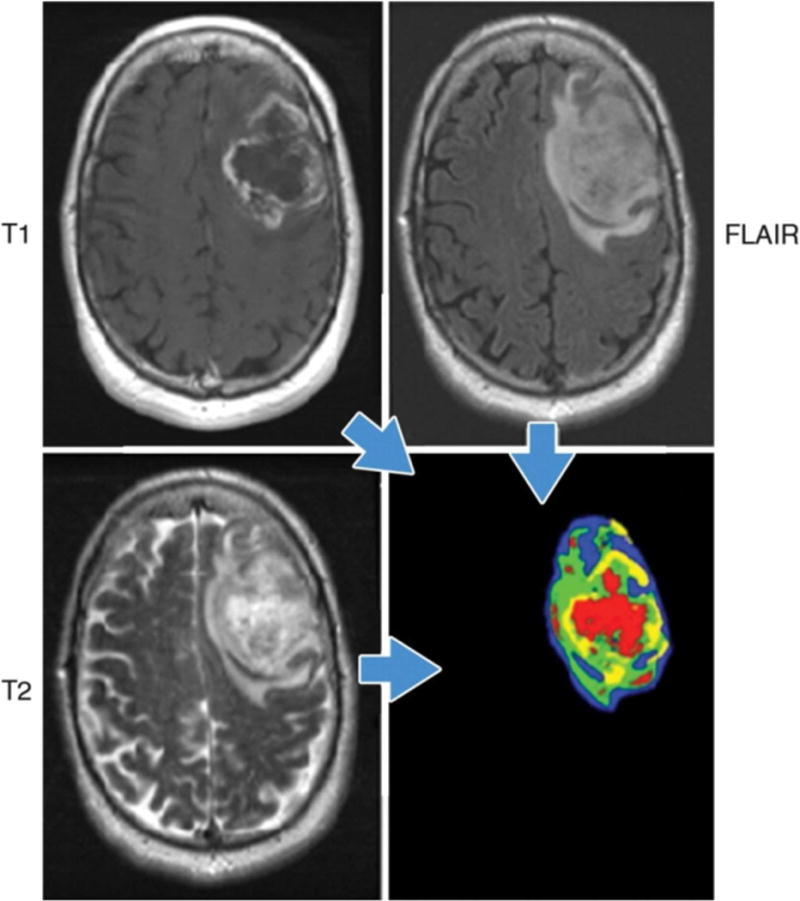
Figure 3.

Example of habitat imaging in a patient with glioblastoma multiforme. Habitat imaging (lower right) is obtained by the combination of contrast-enhanced T1W, T2W, and fluid-attenuated inversion recovery (FLAIR) images. Each voxel of a tumour is assigned a specific colour depending on the combination of signal intensity (high/low) of these sequences, e.g., the red voxel is low on T1W images, and high on T2W and FLAIR images in this case. The clusters of voxels with specific colours yield regions that reflect different physiologic microenvironments, called habitats. This regional analysis would help the deeper understanding of tumour heterogeneity. Figure provided courtesy of R. A. Getenby.
