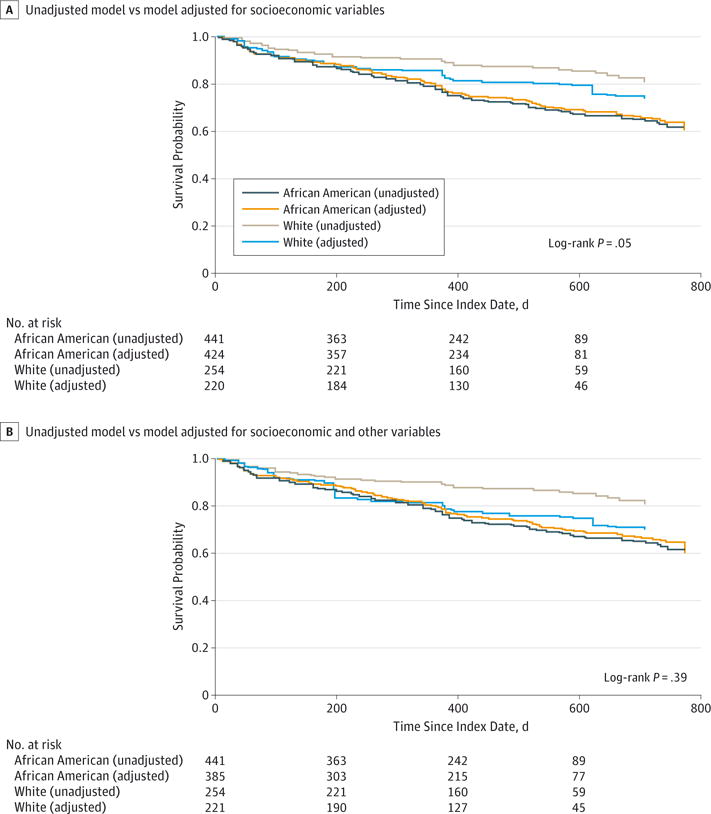
Figure 3. Adjusted Kaplan-Meier Curves After Balancing Procedures Are Completed With Inverse Probability of Treatment Weighting.

The curves use adjusted Kaplan-Meier estimator and log-rank test with inverse probability of treatment weighting.29 Using the trimmed inverse probability of treatment weighting, the log-rank test provides P = .04 in panel A and P = .16 in panel B. A, Comparison of an unadjusted model with a model adjusted for pertinent socioeconomic hardship variables. Adjusted model in panel A includes measures of financial and social hardship, caregiver educational attainment, and caregiver marital status. B, Comparison of an unadjusted model with a model adjusted for pertinent socioeconomic hardship, biological, environmental exposure, disease management, and access to care variables. Adjusted model in panel B includes measures of outdoor allergen sensitization, salivary cotinine, traffic-related air pollution, running out of or missing dose of medication, and vehicle ownership alongside measures of financial and social hardship, caregiver educational attainment, and caregiver marital status.
