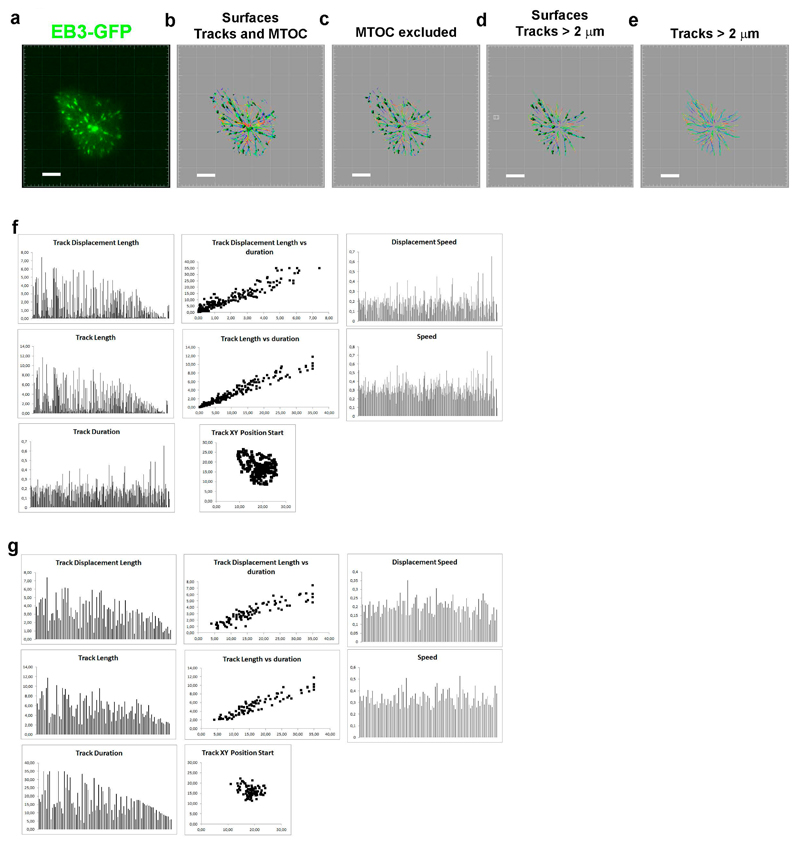
Figure 2. Tracking of +tips from TIRFm imaging.
(a) Fluorescence image from a time-lapse of an EB3-GFP expressing T cell. (b–e) Set of images from different steps of the surface generation from fluorescence time- lapse images and tracks. (b) Initial surfaces and tracks including MTOC. (c) Surfaces and track excluding MTOC. (d) Processed surfaces and tracks excluding MTOC, peripheral tracks and tracks<2 μm. (e) Tracks from (d). Bar, 2 μm. Analysis corresponds to 30 s from the acquired time-lapse. (f). Graphs showing the indi- cated information from the analysis of tracks from the cell shown in (c) excluding the MTOC. (g). Graphs show- ing the indicated information from the analysis of tracks from the cell shown in (e). Duration is expressed in s, length in μm, and speed in μm.s−1

