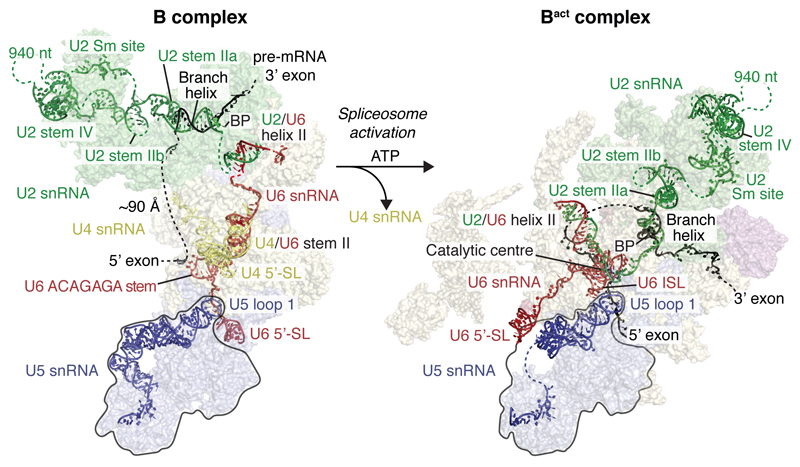
Figure 5. Changes in the RNA network during spliceosome activation.
B and Bact complexes with RNA models superimposed on transparent surfaces of spliceosome proteins. Proteins are coloured as in Fig. 1, and the two structures are aligned with their U5 snRNP foot domain (black outline). The U2 3’ domain and SF3a proteins are modelled based on a low-pass filtered Bact cryo-EM density20 (EMD-4099, see Methods) onto the Bact model21 (PDB ID 5GM6). Internal stem loop, ISL; Stem loop, SL.

