
Figure 5.
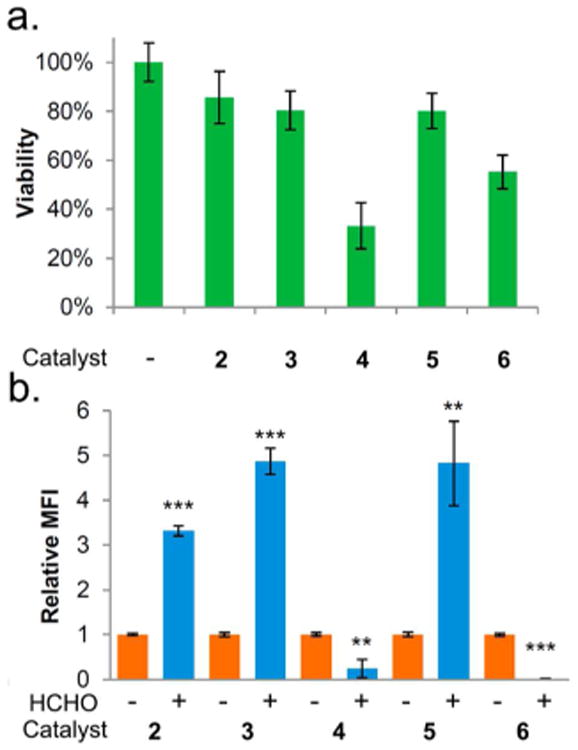
Catalyst screening for intracellular labeling. (a) K562 cell viability at 24 h after incubating with 10 mM catalyst for 1 h; (b) relative fluorescence intensity after 1 h with 10 mM catalyst, 40 μM AFDZ dye with/without 2 mM formaldehyde (HCHO). Error bar indicates standard deviation from n = 3; stars indicate significance in t test, **P ≤ 0.01 and ***P ≤ 0.001.