
Figure 6.
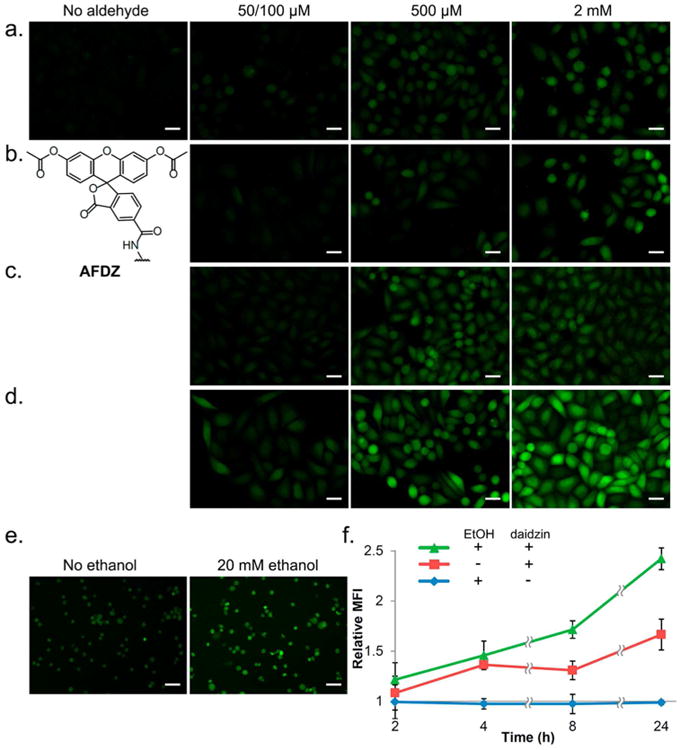
Fluorescence images and flow cytometry data for cellular aldehyde labeling. HeLa cells were incubated with 20 μM of AFDZ dye and 10 mM catalyst 5 and imaged after 1 h with varying concentrations of (a) formaldehyde, (b) glycolaldehyde, (c) acrolein, and (d) acetaldehyde. No washing steps were done. Note that 50 μM was used with acrolein and 100 μM for formaldehyde, glycolaldehyde, and acetaldehyde. (e) K562 cells pretreated with 250 μM daidzin and incubated with 40 μM of AFDZ dye, 10 mM catalyst 5, and with/without 20 mM ethanol. (f) Flow cytometry data monitoring the production of aldehyde over time in K562 cells with/without ethanol. The fluorescence intensities were compared to that obtained from t = 0 without added ethanol and daidzin. Scale bars (20 μM) are shown.