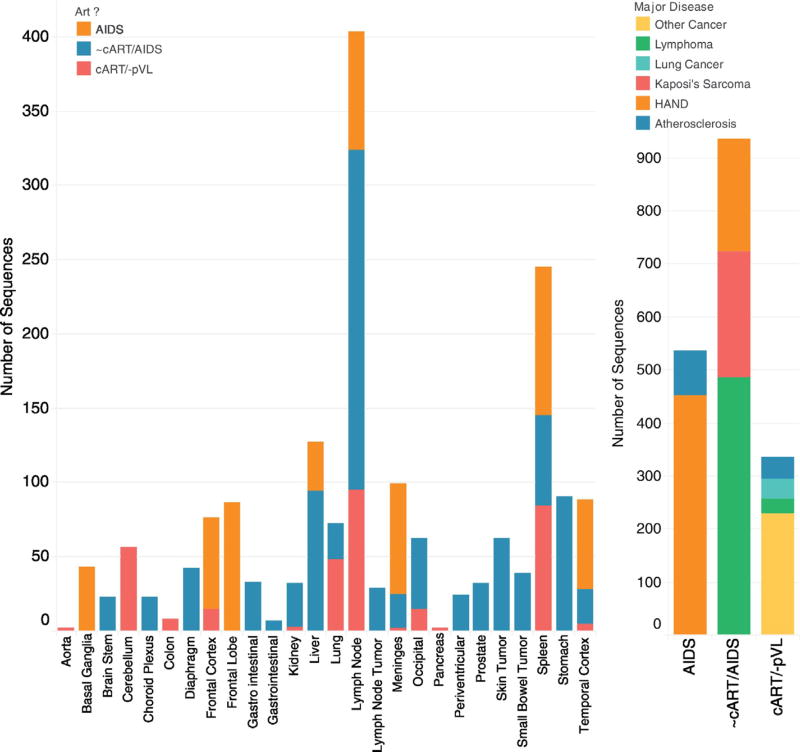
Fig. 1.
Number of sequences, tissues, and subject pathology used for study. Left, the number of sequences for each tissue type is colored by three treatment categories (AIDS subjects without ART, subjects with varied ART exposure who died from AIDS and sequences derived from cART+ subjects who died with no viral load). Right, the number of sequences studied for each treatment category is colored by primary disease pathology of the nine subjects studied. (For interpretation of the references to color in this figure legend, the reader is referred to the web version of this article.)

