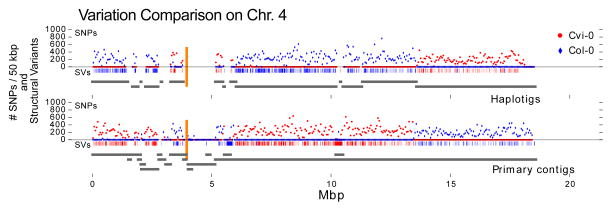
Figure 2. SNP density and Structural Variations in the FALCON-Unzip F1 Arabidopsis assembly.
The plot shows the primary contigs and haplotigs aligned to chromosome 4 of the TAIR reference assembly as grey line segments. Blue and Red colored dots show the number of Col-0 and Cvi-0 specific SNPs, respectively, per 50 kbp region of the assembled contig. The vertical orange lines indicate the centromere locations. The short vertical tick marks above the grey lines indicate the structural variations against Col-0 (blue) and Cvi-0 (red).

