
Figure 6.
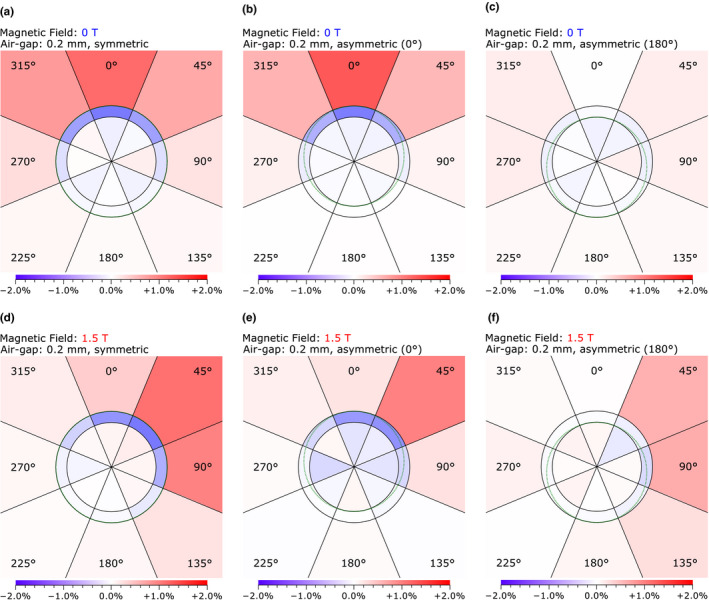
The difference caused by the presence of the air gap to the percentage contribution to the chamber dose by electrons originating from the regions outside, adjacent to, and inside the Farmer chamber (Fig. 2). Each region has been further subdivided into octants to provide better insight into the origin of the differences. The values are relative to the total dose to the chamber when no air gap is present. The dotted line illustrates the outline of the air gap that was present for each case. The regions are not to scale. The photon beam is directed from the top to the bottom. [Color figure can be viewed at wileyonlinelibrary.com]