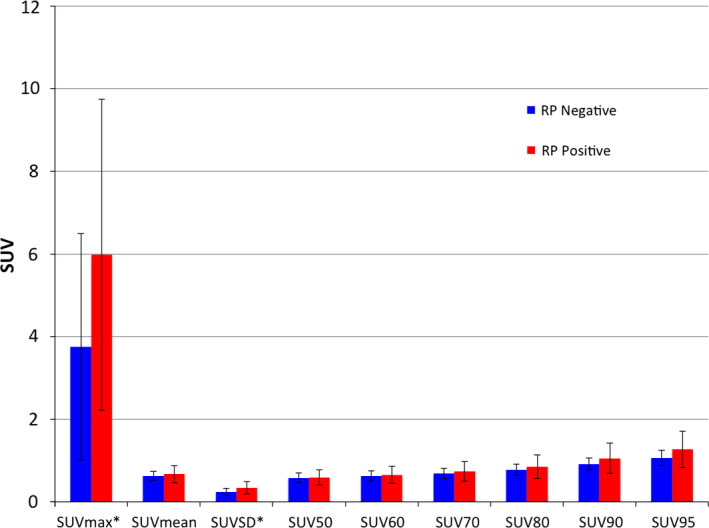
Figure 2.

Mean SUV parameter values across patients, separated by RP status. Error bars indicate one standard deviation. Significant differences between groups using Student's t‐test (p < 0.05) are indicated with an asterisk (*). [Color figure can be viewed at wileyonlinelibrary.com]
