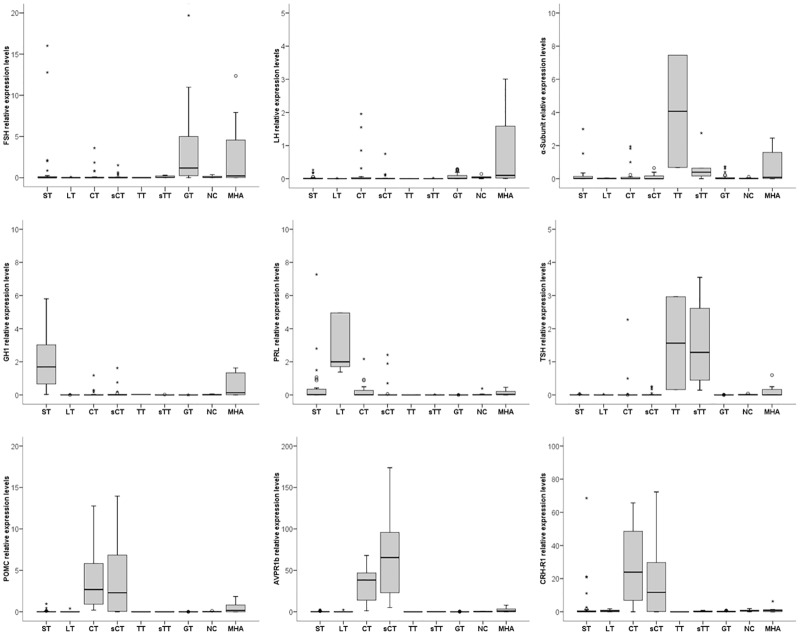
Fig 1. Relative gene expression of hormone and receptor implicated in the molecular classification of pituitary adenomas (n = 142).
Figure shows the bar chart of the gene expression levels analyzed for each subtype. Silent lactotroph and silent somatotroph are not represented because there was none in our series.

