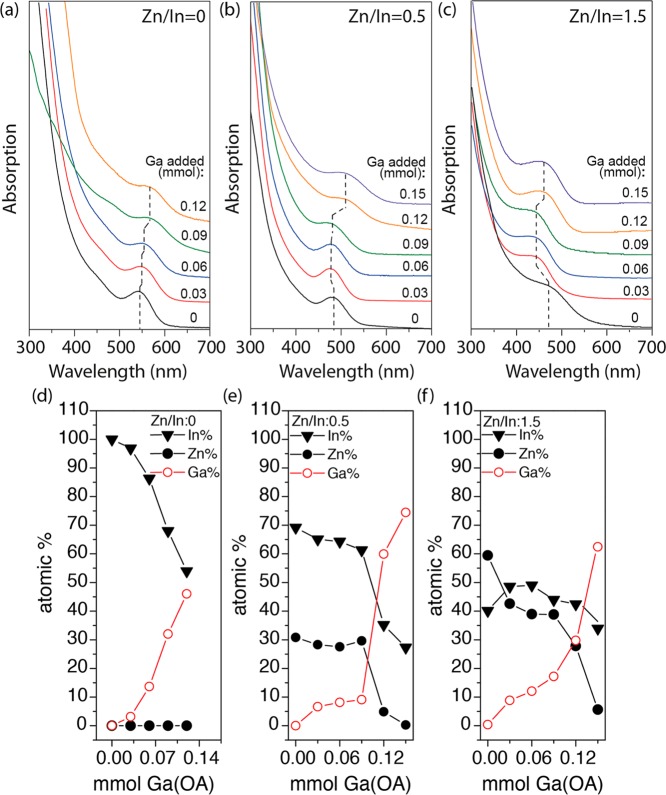
Figure 3.
(a–c) Absorption spectra of InZnP QDs with varying initial concentrations of Zn at different stages during the addition of Ga(OA)3. (d–f) The relative In, Zn, and Ga content measured using ICP in the InZnP + Ga(OA)3 QDs as a function of the amount of Ga(OA)3 added, for purified cores with different Zn/In feed ratios: (d) 0, (e) 0.5, and (f) 1.5.

