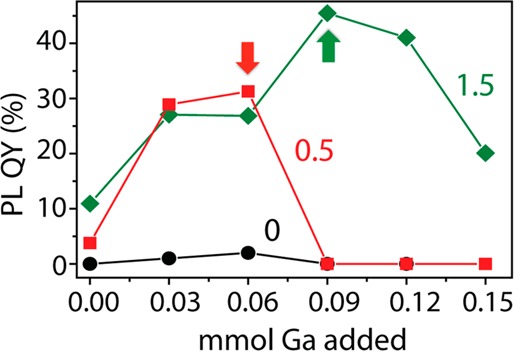
Figure 5.

Plot of the PL QY of InZnP/InGaP QDs with different initial Zn/In ratios (0, black dots; 0.5, red squares; 1.5, green diamonds) as a function of the amount of Ga precursor added. The arrows highlight the point of maximum PL QY for each sample.
