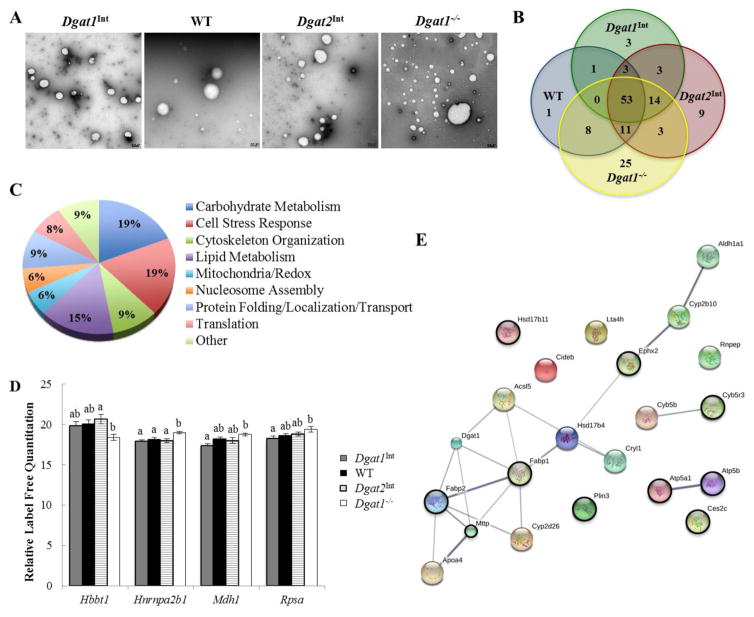
Figure 5. Varying levels of intestinal Dgat1 and Dgat2 alters the enterocyte CLD proteome.
CLDs were isolated from enterocytes of Dgat1Int, WT, Dgat2Int, and Dgat1−/− mice 2 hours after a 200μl oral olive oil gavage. (A) Negative stain EM of the intestinal CLD-enriched fraction from a representative sample for each mouse model. Scale bar = 0.5 μm. (B) Overlap of CLD-associated proteins for each mouse model, identified by proteomics. (C) Biological functions of CLD-associated proteins common to all four mouse models, classified based on GO terms (for biological process & molecular function). (D) Differentially expressed CLD-associated proteins common among all mouse models. Different letters denote significantly different relative protein levels (p < 0.05). (E) String map of all proteins with a GO term/functional classification related to lipid/lipoprotein metabolism. Black circles indicate proteins identified in all four genotypes.

