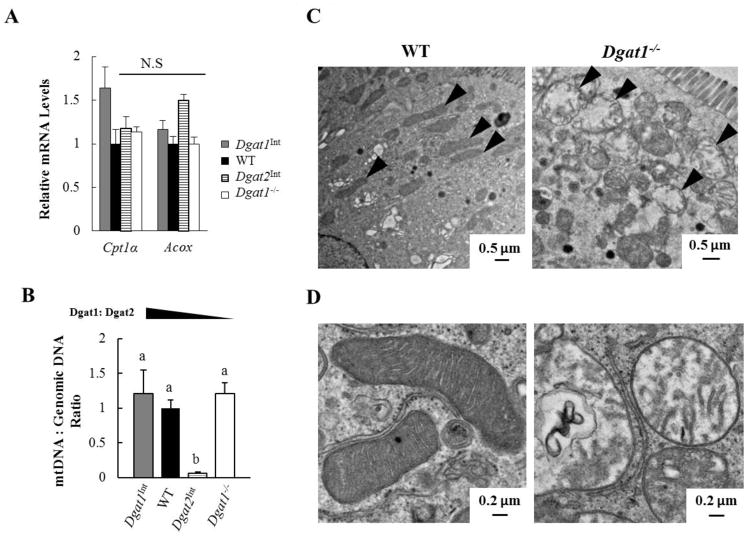
Figure 6. Varying levels of intestinal Dgat1 and Dgat2 impacts enterocyte mitochondrial biology.
(A) qPCR analysis of mRNA levels of genes involved in FAO. (B) qPCR analysis of the ratio of mitochondrial DNA to nuclear DNA for the assessment of mitochondrial content. WT mice was the reference group, with its DNA level set as 1 (n=3–4 mice/group). Different letters denote significant differences, p < 0.05 (one-way ANOVA, Tukey HSD test), N.S = not significant. (C) Representative TEM images of mitochondria (black arrow) within enterocytes of WT and Dgat1− /− mice 2 hours after a 200 μl oral olive oil gavage. (D) Representative TEM images of normal mitochondria (left) and round, swollen mitochondria (right) found in Dgat1−/− mice 2 hours after a 200 μl oral olive oil gavage.

