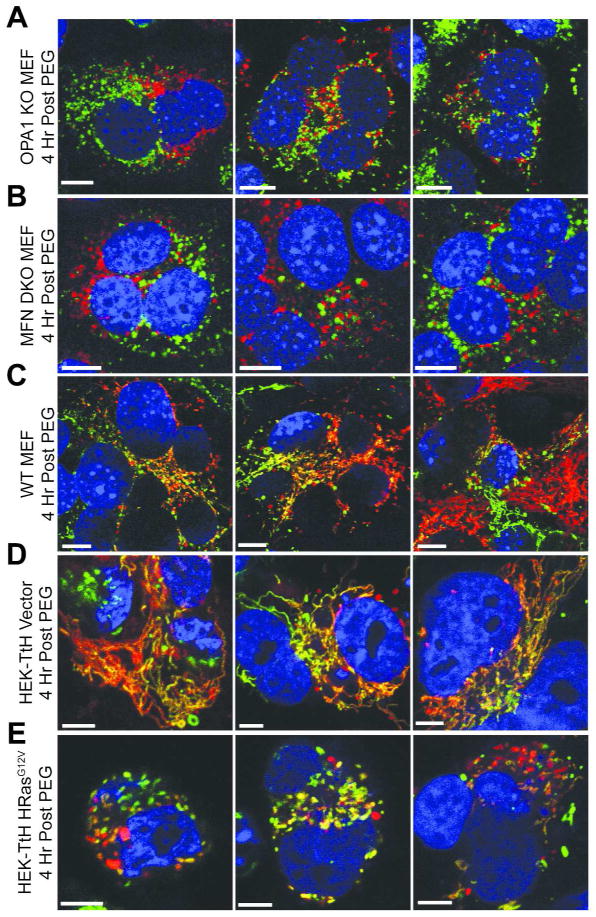
Figure 2.
Confocal Microscopy 4 Hrs Post PEG Treatment of MEF and HEK cell lines. Mitochondrial morphologies of fused cells containing separate fluorescently labeled sets of OPA1 KO MEFs (A), MFN DKO MEFs (B), WT MEFs (C), HEK-TtH cells stably expressing either vector alone (D) or HRasG12V (E) after treatment with polyethylene glycol (PEG), obtained by laser scanning confocal microscopy. Each column represents a replicate image of the respective cell type. Cells were treated with 50% (wt/vol) PEG 1500/DMEM for 2 minutes, followed by incubation in 10% FBS/DMEM containing Cyclohexamide (33μg/mL) for 4 Hrs, fixed and analyzed by confocal microscopy. Green, mito-YFP; Red, mito-DsRed; Blue, DAPI. Scale bar, 10 μm.

