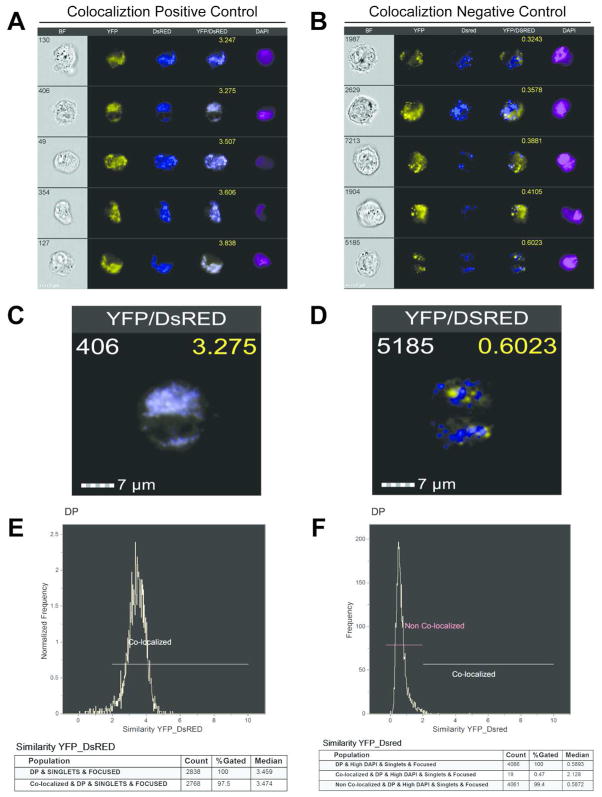
Figure 4.
Establishment of co-localized and non-co-localized cutoffs based on Positive and Negative Mitochondrial Fusion Controls. (A–B) Representative images of HEK-TtH co-expressing Mito-YFP and Mito-DsRed as the positive fusion control (A) or MFN DKO MEFs after PEG treatment as the negative fusion control(B). White number, Cell number; Yellow number, co-localization score. (C–D) Single merged YFP/DsRed Image of positive control (C) or negative control (D). (E–F) Histograms depicting the range of co-localization scores and statistics for the positive control (E) and negative control (F).

