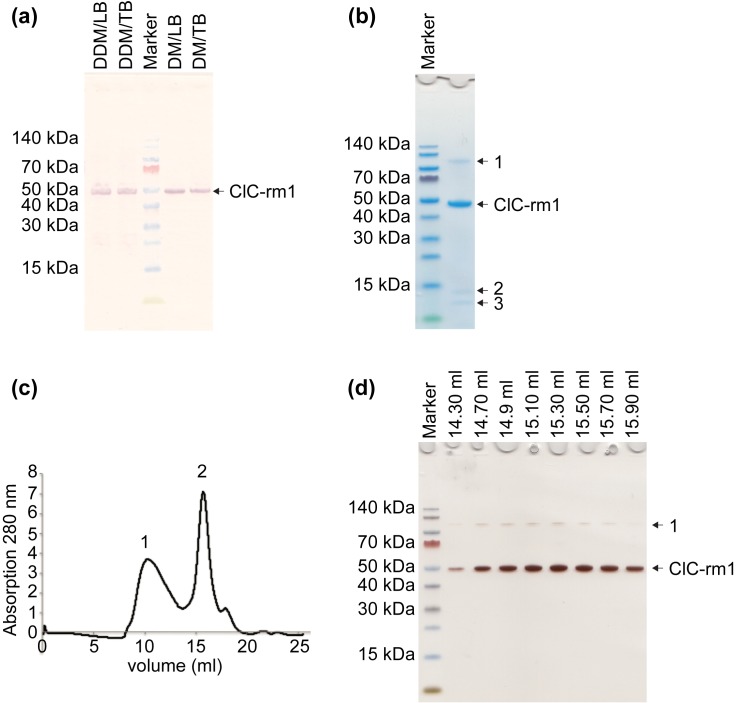
Fig 2. Expression and purification profiles of ClC-rm1 in pET30a.
(a) ClC-rm1 was expressed using E. coli strain BL21(DE3) in either LB or TB media. Cells were harvested and the membranes isolated. Membranes were then solubilized using either DDM or DM. Western blot shows ClC-rm1 expressed in LB and TB, and solubilized membranes using DDM or DM. Lanes 1 and 2: fractions of DDM-solubilized membranes with cells grown in LB (1) and TB (2). Lane 3: molecular mass marker. Lanes 4 and 5: fractions of DM solubilized membranes with cells grown in LB (4) and TB (5). (b) ClC-rm1 was purified in DDM using Ni2+ resin. Lane 1: molecular mass markers. Lane 2: ClC-rm1 monomer band at ~50 kDa and three other minor bands (labeled as 1, 2 & 3). (c) Superose 6 SEC elution profile of ClC-rm1 in DDM. Peak 1 corresponds to the void volume. Peak 2 corresponds to ClC-rm1. (d) Silver stained SDS-PAGE gel of ClC-rm1 after SEC. Lane 1: molecular mass marker. The rest of the lanes correspond to the Superose 6 SEC fractions. ClC-rm1 monomer band is at ~50 kDa with only one additional band (labeled as 1).

