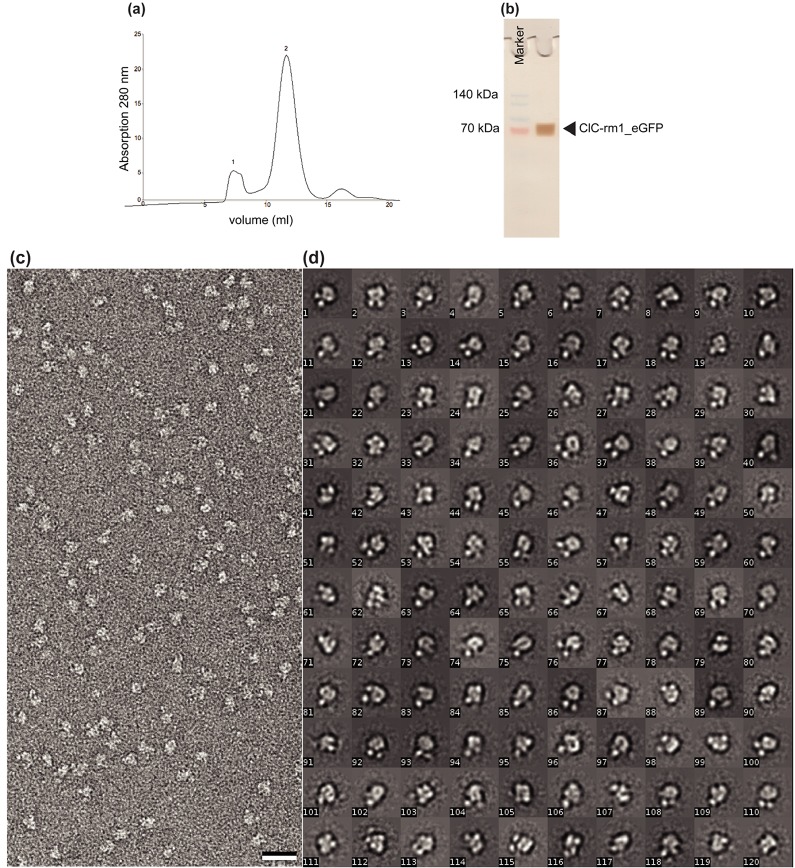
Fig 8. Elution profile of ClC-rm1_eGFP in DDM after superdex 200 SEC.
Peak 1 corresponds to the void volume. Peak 2 corresponds to ClC-rm1_eGFP. (b) SDS-PAGE gel of ClC-rm1_eGFP after SEC. Lane 1: molecular mass marker. Lane 2 ClC-rm1_eGFP after SEC. ClC-rm1 monomer band is around ~80 kDa. (c) Micrograph of negatively stained ClC-rm1_eGFP particles. DDM-solubilized ClC-rm1_eGFP particles are mono-disperse. Scale bar 20 nm (d) Representative class averages of ClC-rm1_eGFP in DDM.

