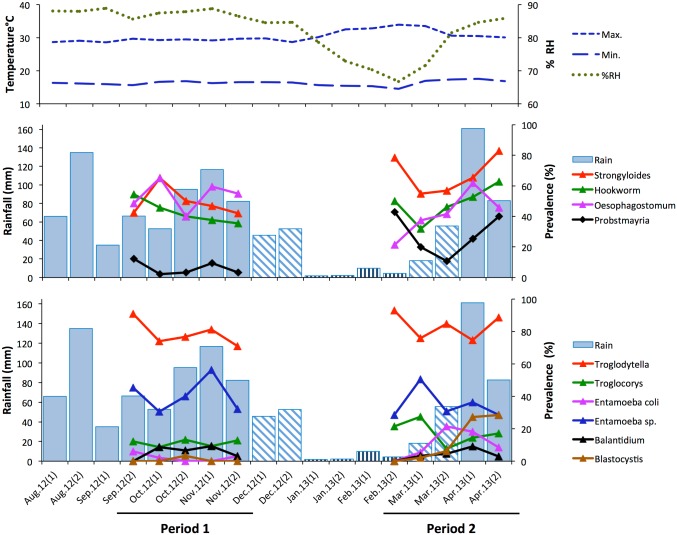
Fig 3. Variation in parasite prevalence in relation to rainfall, temperature and humidity.
Climate data are shown for the period August 2012–April 2013, spanning both survey periods and beginning one month prior to period 1. Top: Biweekly mean daily maximum and minimum temperature and % relative humidity (RH); Middle: Biweekly rainfall and % faecal samples positive for nematodes (hookworm, Oesophagostomum sp., Probstmayria gombensis and Strongyloides sp.). Bottom: Biweekly rainfall and % faecal samples positive for protozoan parasites (Balantidium coli, Blastocystis sp., Entamoeba coli, Entamoeba sp., Troglocorys cava, Troglodytella abrassarti). The patterning of rainfall bars indicate whether biweekly periods were in months classified as wet (solid), transient (hatched) or dry (vertical lines); see Methods. Only parasites detected in >5% of samples (n = 432) are shown; for the number of faecal samples analysed per biweekly period, see Supporting Information S1 Data File.

