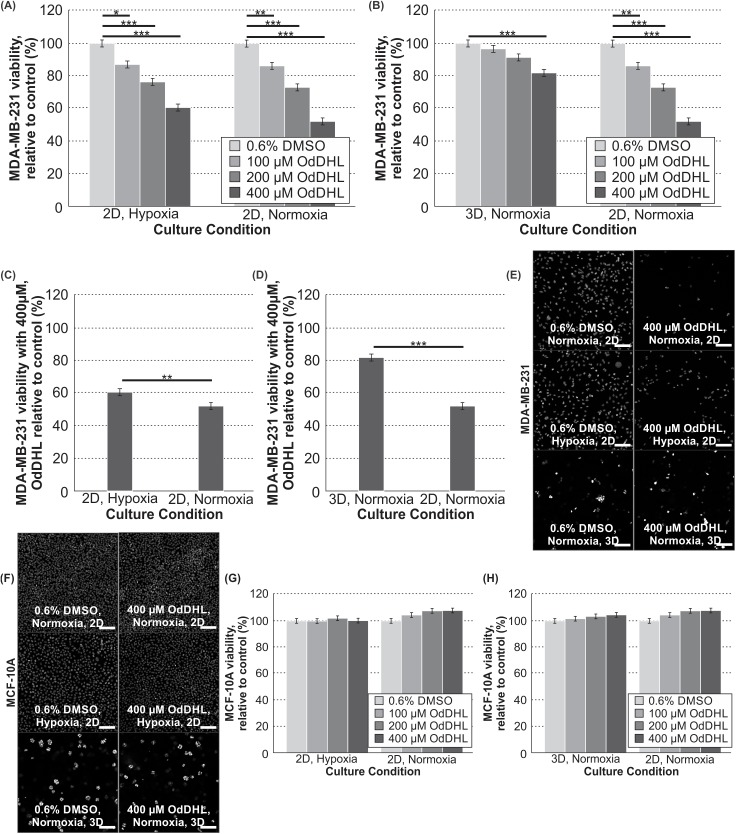
Fig 1. OdDHL has a cell-specific and significant impact on MDA-MB-231 viability in all culture conditions.
Significant differences in mean MDA-MB-231 viability at 100, 200 and 400 μM concentrations relative to the control in hypoxia and normoxia in 2D (A) and 3D and 2D in normoxia (B); *** = p-value < 0.0001, ** = p-value < 0.01, * = p-value < 0.05 based on Tukey post-hoc differences. Significant differences in MDA-MB-231 viability relative to the control between culture conditions with 400 μM treatment in hypoxia and normoxia in 2D (C) and 3D and 2D in normoxia (D); *** = p-value < 0.0001, ** = p-value < 0.01 based on least mean contrasts. (E) Photomicrographs of MDA-MB-231 cells cultured in normoxia (2D), hypoxia (2D), and 3D (normoxia) with fluorescence microscopy (with DAPI staining; scale bar = 100 μm) at 100X magnification after 24 hours of OdDHL treatment. (F) Photomicrographs of MCF-10A cells cultured in normoxia (2D), hypoxia (2D), and 3D (normoxia) with fluorescence microscopy (with DAPI staining; scale bar = 100 μm) at 100X magnification after 24 hours of OdDHL treatment. Differences in MCF-10A viability relative to the control at 100, 200 and 400 μM concentrations in hypoxia and normoxia in 2D (G) and 3D and 2D in normoxia (H). Error bars represent standard error of the mean.

