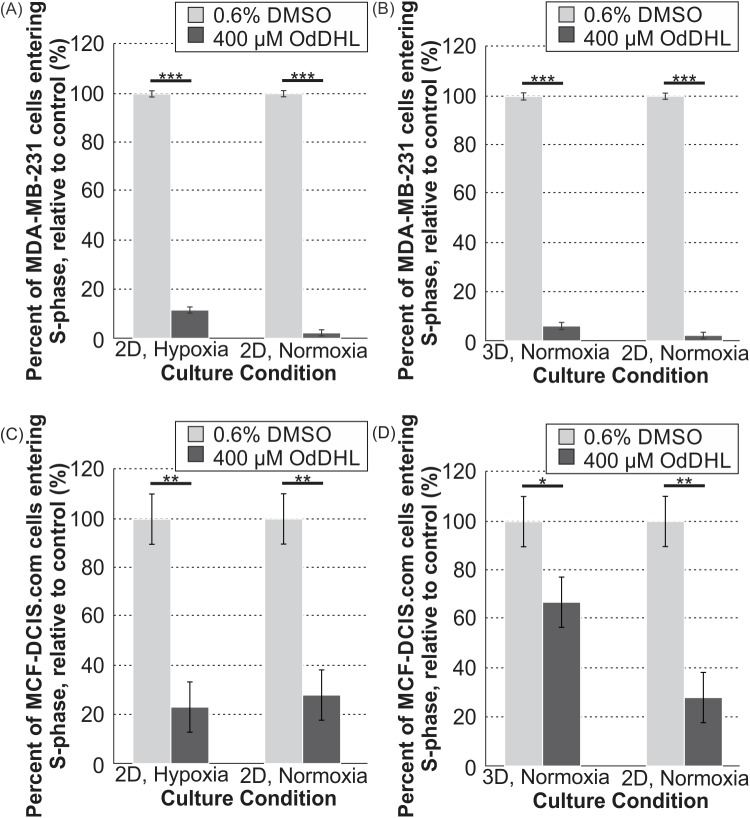
Fig 3. 400 μM OdDHL treatment significantly impacts the proliferation rate of MDA-MB-231 and MCF-DCIS.com cells in all conditions.
Significant differences in the mean percent of MDA-MB-231 cells entering S-phase of proliferation in the 0.6% DMSO and 400 μM OdDHL treatment groups in hypoxia and normoxia in 2D for N = 4 (A) and 3D and 2D in normoxia for N = 3 (B); *** = p-value < 0.0001 based on least mean contrasts. Significant differences in the mean percent of MCF-DCIS.com cells entering S-phase of proliferation in the 0.6% DMSO and 400 μM OdDHL treatment groups in hypoxia and normoxia in 2D for N = 3 (C) and 3D and 2D in normoxia for N = 3 (D); ** = p-value < 0.001, * = p-value < 0.05 based on least mean contrasts. Error bars represent standard error of the mean.

