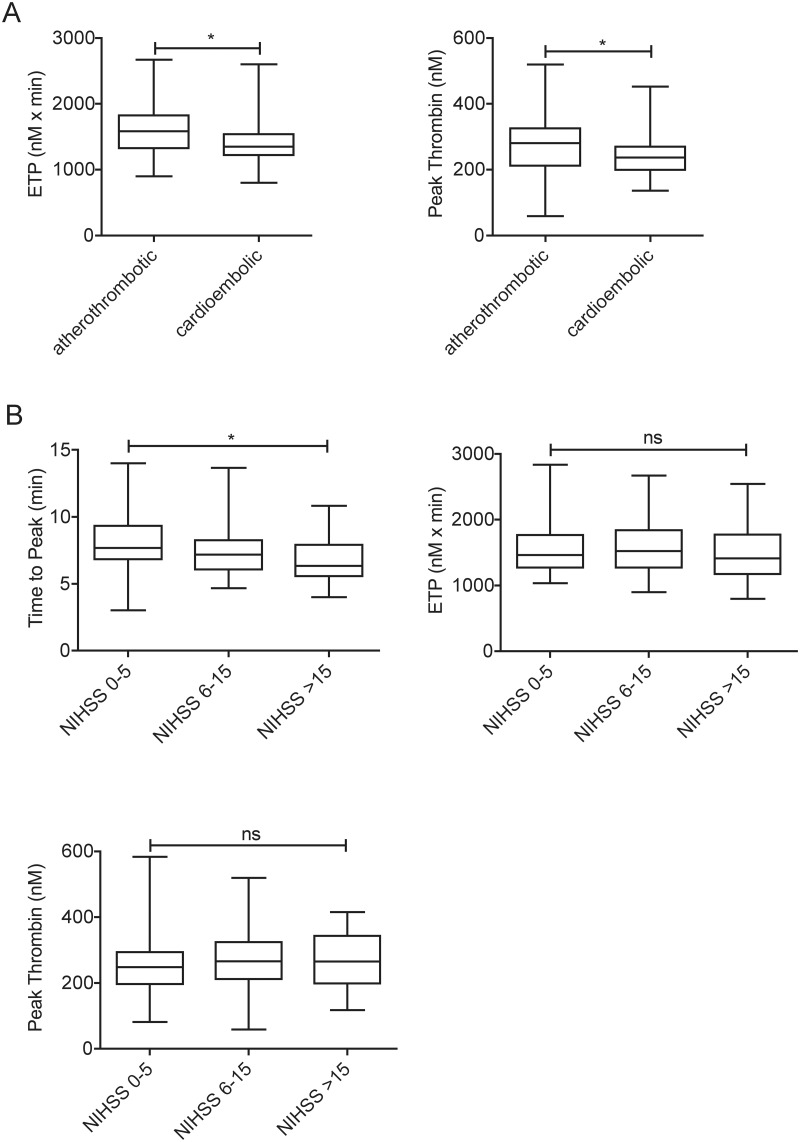
Fig 1. The association of thrombin generation parameters with the etiology (A) and the severity (B) of stroke.
Box and whisker plots indicate median, interquartile range and total range. Statistical significance was assessed by Mann-Whitney U test (A) and Kruskal-Wallis and Dunn’s Multiple Comparison Test (B). *Statistically significant (p<0.05), ns: non-significant. ETP: Endogenous Thrombin Potential, NIHSS: National Institutes of Health Stroke Scale.

