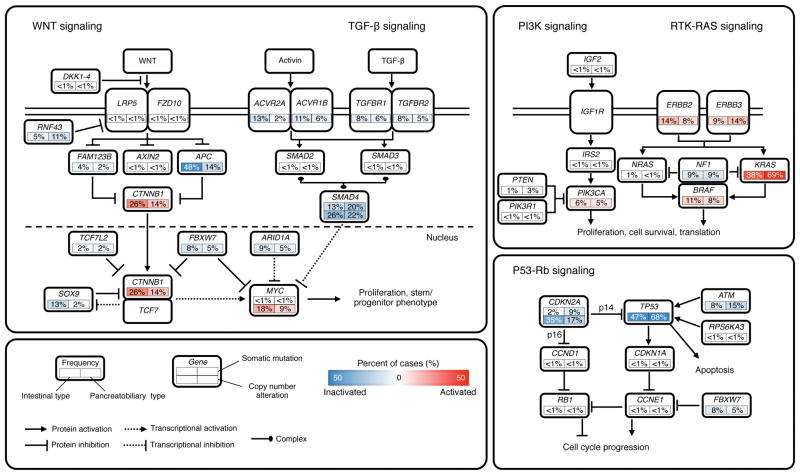
Figure 2. Diversity and Frequency of Genetic Changes Leading to Deregulation of Signaling Pathways in Ampullary Carcinomas.
Mutation frequencies are expressed as a percentage of cases analyzed in the validation screen: intestinal-type, n = 93; pancreatobiliary-type, n = 66. Frequencies of high-level focal amplifications and deletions are expressed as a percentage of cases analyzed in the discovery screen: intestinal-type, n = 32; pancreatobiliary-type, n = 23. Red denotes activated genes and blue denotes inactivated genes.

