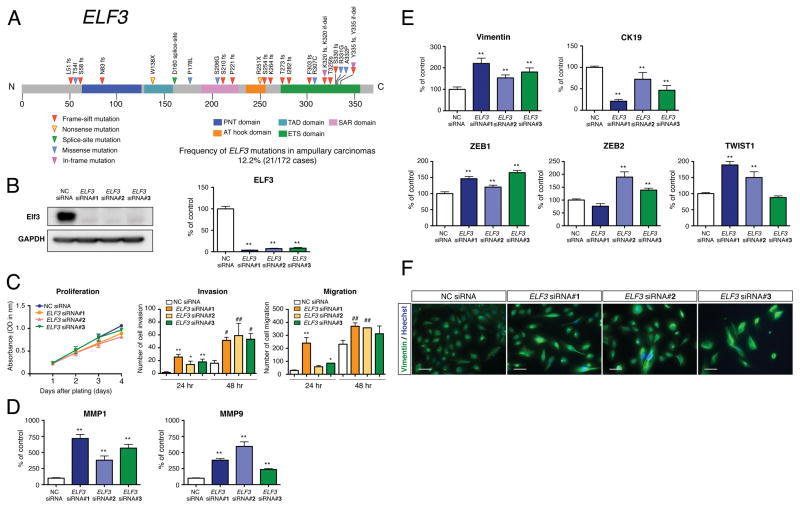
Figure 4. Recurrent ELF3 Mutations and Functional Assays.
(A) Recurrent somatic mutations of ELF3 in 21 ampullary carcinomas and one duodenal carcinoma. ELF3 is shown in the context of the protein domain model derived from UniProt and Pfam annotations. Numbers refer to amino acid residues. Each inverted triangle represents an individual mutated tumor sample: frameshift, nonsense, splice-site, missense and in-flame mutations are represented by filled red, yellow, green, blue and pink inverted triangles, respectively. Domains are depicted with various colors with an appropriate key located below the domain model.
(B) Representative western blot for the expression of Elf3 in HBDEC2-3H10 cells treated with the specific siRNA (ELF3 siRNA #1, #2 and #3) and negative control siRNA (NC siRNA). Quantitative RT-PCR analysis for the expression of ELF3 in control and ELF3 knockdown cells. Total RNA was prepared 72 hr after transfection (mean ± SEM n = 4 per group, **p < 0.01 versus NC siRNA).
(C) Cellular proliferation and invasion/migration assays with control and ELF3 knockdown cells. Cell growth was measured for 1, 2, 3 and 4 days and performed in triplicate (mean ± SEM). Cell invasion and migration were measured for 24 and 48 hr and performed in three times (mean ± SD, *p < 0.05 versus 24 hr NC siRNA, **p < 0.01 versus 24 hr NC siRNA, #p < 0.05 versus 48 hr NC siRNA, ##p < 0.01 versus 48 hr NC siRNA).
(D) Quantitative RT-PCR analysis for the expression of MMP1 and MMP9 in control and ELF3 knockdown cells. Total RNA was prepared 72 hr after transfection (mean ± SEM, n = 4 per group, **p < 0.01 versus NC siRNA).
(E) Expression of vimentin, CK19, ZEB1, ZEB2 and TWIST1 in control and ELF3 knockdown cells determined by quantitative RT-PCR analysis (mean ± SEM, n = 4 per group, **p < 0.01 versus NC siRNA).
(F) Immunofluorescence analysis for the expression of vimentin in control and ELF3 knockdown cells. Hoechst staining (blue) identifies the nuclei of all cells in the field. Scale bars = 50 μm.
See also Figure S5 and Tables S4, S7 and S8.

