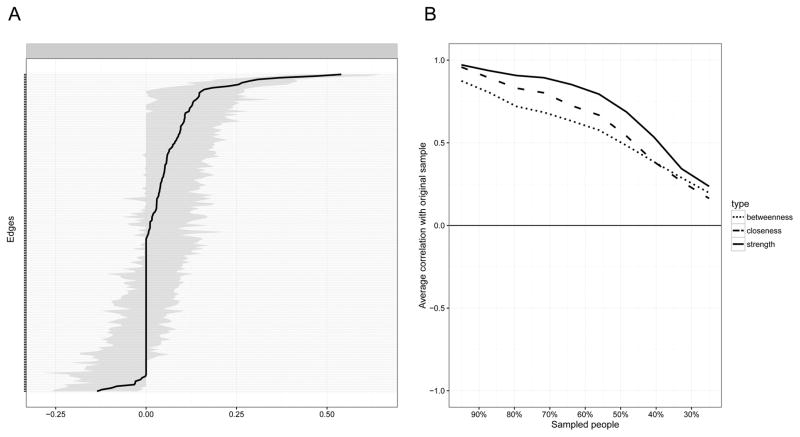
Figure 2.
Network Stability of 20 CES-D Symptoms (n = 515).
Note. A. This graph indicates the edge weights (solid line) and the 95% confidence intervals around these edge weights (grey bars) in the network presented in Figure 1A; B. Represents the correlation of the centrality of nodes in the original network (Figure 1A) with the centrality of networks sampled while dropping participants. When the correlation after dropping a substantial amount of participants is high, it means the centrality estimates in the original network can be considered stable.

