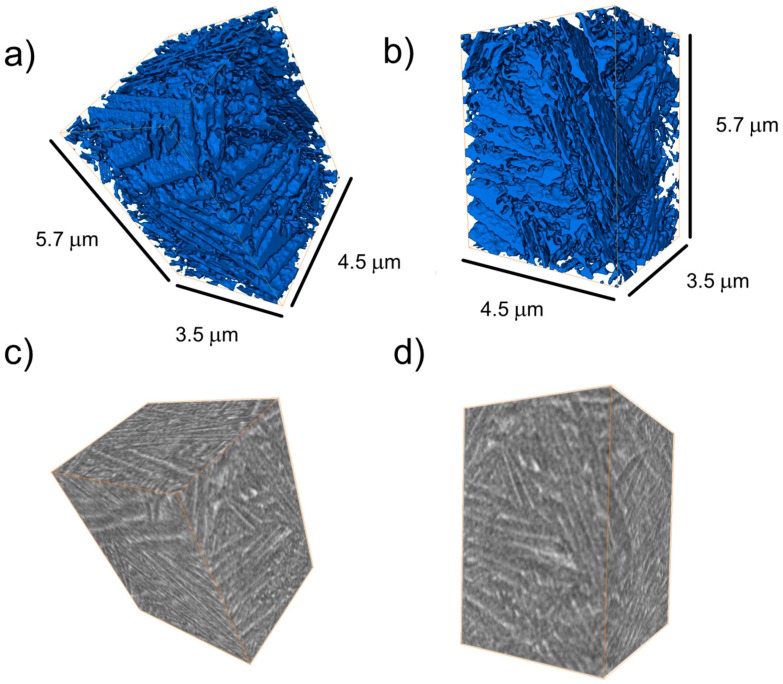
Figure 8.
(a,b) Illustrative perspectives of the interconnected β network (in blue) segmented from (c,d) its associated holographic X-ray computed tomography (HXCT) reconstruction (voxel size = (10 nm)3 and β matrix in bright grey) corresponding to a representative volume of the microstructure formed at the bottom part of the Ti-64 sample (i.e., z ~ 0 mm) upon SLM.

