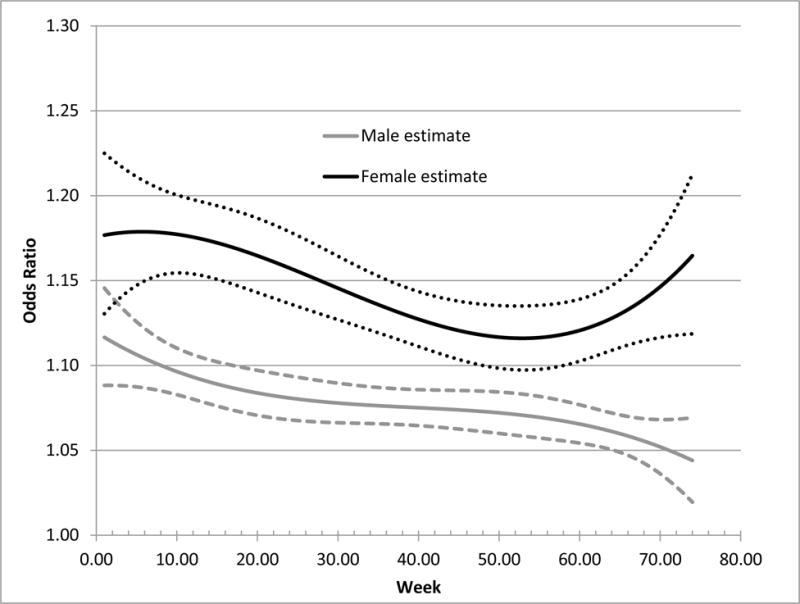
Figure 3.

TVEM showing number of drinks predicting odds of a negative consequence from beginning of freshmen through end of sophomore year. Dotted lines indicate 95% confidence intervals. Time is measured and analyzed continuously but is labeled in intervals of 10 weeks for ease of presentation.
