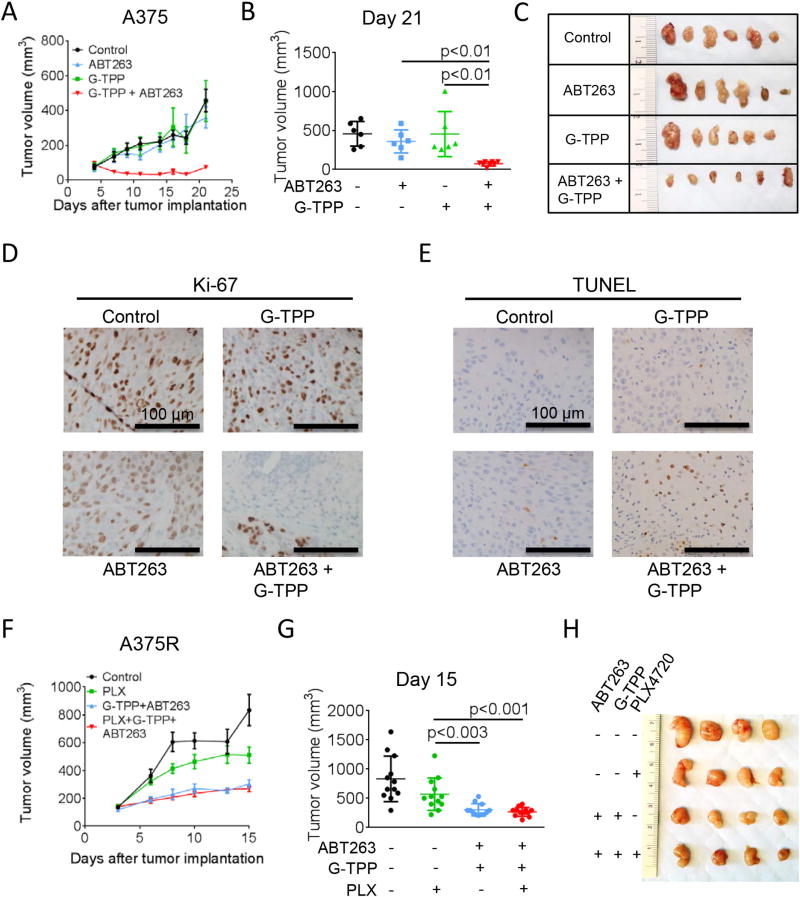
Figure 7.
Combined treatment with ABT263 and G-TPP reduces the tumor growth rate of B-RafV600E inhibitor responsive and resistant melanomas in vivo. A, 1×10⁶ A375 melanoma cells were implanted subcutaneously into nude mice. After tumor formation animals were treated intraperitoneally with vehicle, G-TPP (5 mg/kg), ABT263 (50 mg/kg) or both agents. Data are presented as mean and SEM. Tumor growth curves show the development of tumor size for each treatment group. B, Scatter plots display the quantitative representation of the tumor size among the different treatments toward the end of the experiment (day 21). C, Photographs of representative tumors explanted from mice treated as described for A. D, Representative microphotographs of tissue sections stained for Ki-67. Magnification, 20×. E, Representative microphotographs of tissue sections subjected to TUNEL staining. Magnification, 20×. F, 1×10⁶ B-RafV600E inhibitor (PLX-4720)-resistant A375R melanoma cells were treated intraperitoneally with vehicle, PLX-4720 (25 mg/kg), G-TPP (5 mg/kg) plus ABT263 (50 mg/kg) or all three agents. Data are presented as mean and SEM. Tumor growth curves show the development of tumor size for each treatment group. G, Scatter plots display the quantitative representation of the tumor size among the different treatments toward the end of the experiment (day 15). H, Photographs of representative tumors explanted from mice treated as described for F

