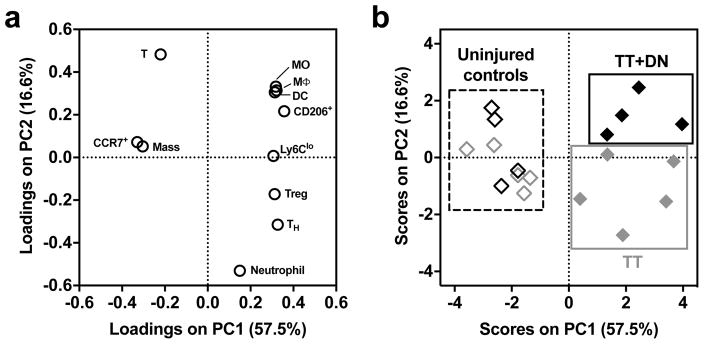
Figure 5. Unsupervised principal component analysis of flow cytometry quantification.
(A) Loadings (weight coefficients) plot of the 11 input variables in the reduced principal component space. Input variables are: muscle mass, MΦ (% of cells), MO (% of cells), DC (% of cells), T lymphocyte (% of cells), neutrophil (% of cells), CD206+ (% of MΦ), CCR7+ (% of MΦ), Ly6Clo (% of MO), TH (CD4+CD3+ % of CD3+), and Treg (CD25+CD4+CD3+ % of CD4+CD3+). (B) Injury conditions are separated by the model in the scores plot (TT, n=5; TT+DN, n=4). Quality-of-fit metrics are provided in Methods.

