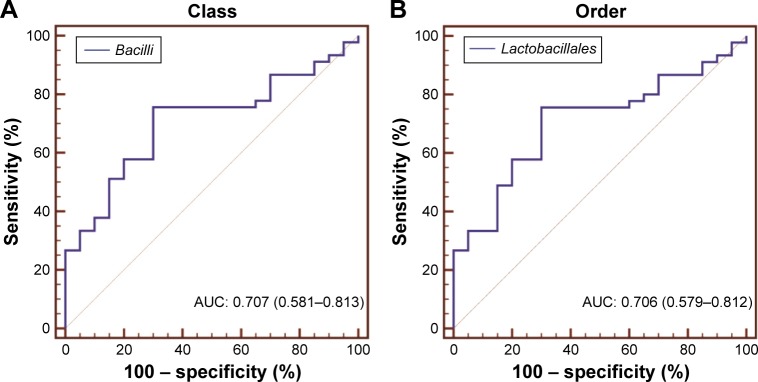
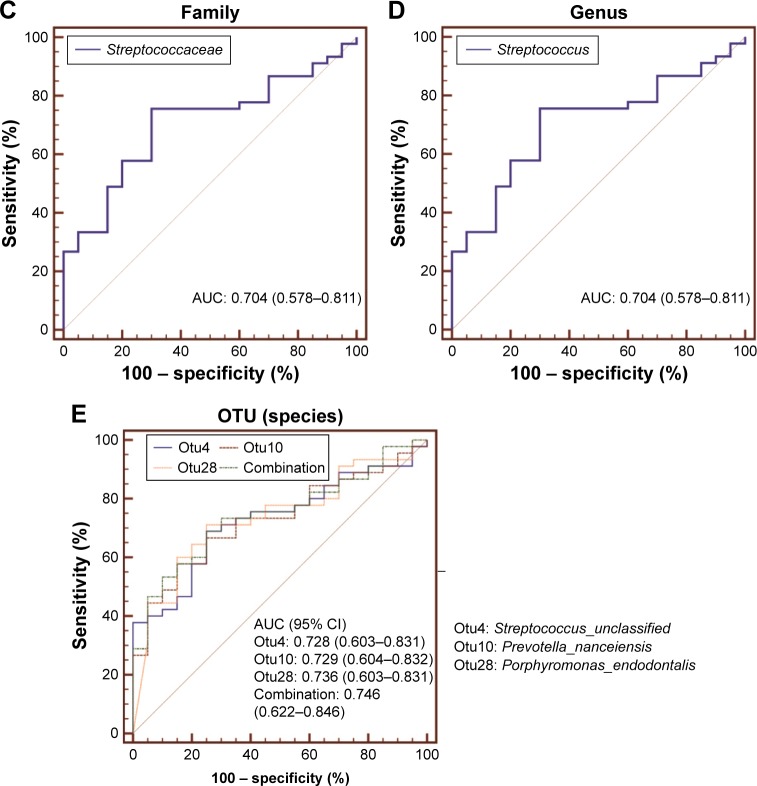
Figure 6.
Biomarker potential for COPD at different taxonomic levels.
Notes: ROC curve analysis was used to evaluate the biomarker potential of specific taxa in (A) class, (B) order, (C) family, (D) genus and (E) OTU (species) level for COPD. Bacterial taxa with an AUC of greater than 0.7 are presented.
Abbreviations: AUC, area under curve; OTU, operational taxonomic unit; ROC, receiver operating characteristic.


