Figure 12.

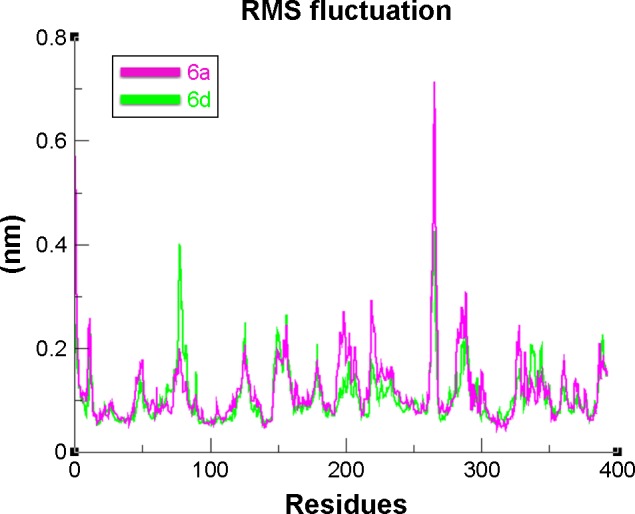
RMSF graph of 6a and 6d at 15 ns.
Note: The graph lines with purple and green colors represent 6a and 6d complexes, respectively.
Abbreviation: RMSF, root mean square fluctuation.

RMSF graph of 6a and 6d at 15 ns.
Note: The graph lines with purple and green colors represent 6a and 6d complexes, respectively.
Abbreviation: RMSF, root mean square fluctuation.