. 2017 Jun 26;6:e25736. doi: 10.7554/eLife.25736

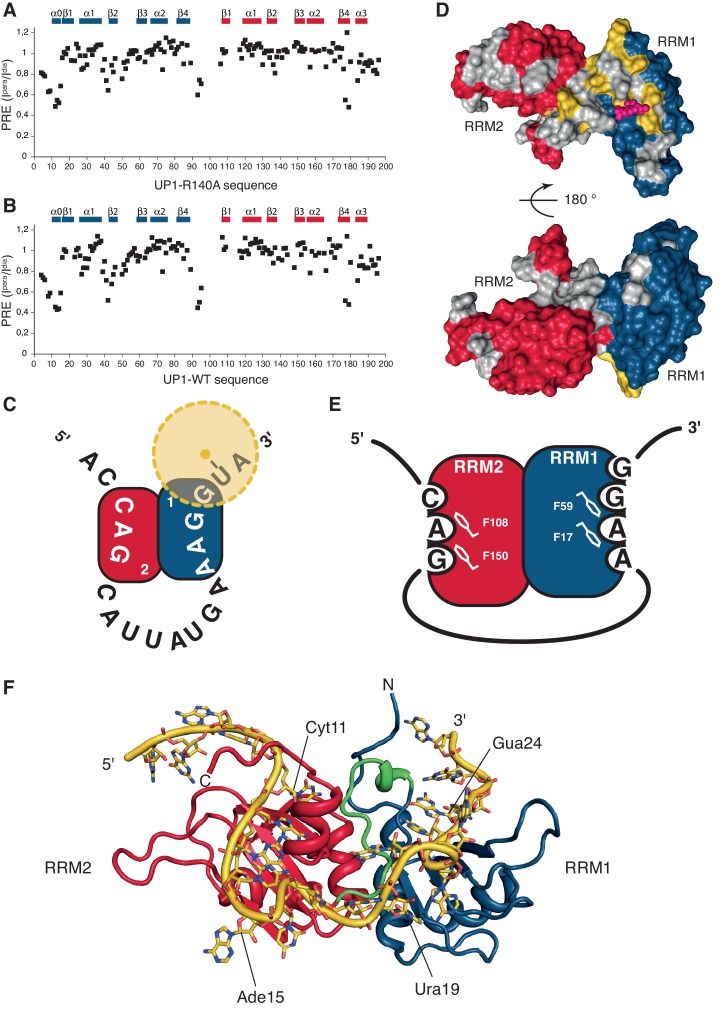
Figure 4. HnRNP A1 RRMs are looping out RNA with RRM2 binding the 5´-motif and RRM1 the 3´-motif.

(A–B) Paramagnetic relaxation enhancement (PRE) data from a spin label attached to a 4-thio-U nucleotide near the 3´-end of the ISS-N1 for (A) UP1-R140A protein bound to the modified ISS-N1 and (B) UP1-WT bound to the same modified ISS-N1. Secondary structure elements are drawn above the histograms. (C) Schematic representation of the modified ISS-N1 binding to hnRNP A1 RRMs. RRM2 is in red, and RRM1 in blue. The RNA sequence is written from the 5´-end to the 3´-end. The spin label is attached to a 4-thio-U located just after the RRM1 binding motif (AAGG). The spin label is represented as a yellow dot, and the PRE effect symbolized with a faint halo in yellow. (D) Surface representation of the residues in UP1-WT affected by the presence of the spin label near the 3´-end of the modified ISS-N1 RNA. The surface of hnRNP A1 RRMs is represented in red and blue for RRM2 and RRM1, respectively. Residues for which PRE data is not available due to a missing assignment in the bound form or due to severe signal overlaps are colored in gray in order to make them not appear as ‘not affected’. Residues with a ratio of the intensity in the oxidized or paramagnetic state over the intensity in the reduced or diamagnetic state (Ipara/Idia) lower than 0.7 are colored in yellow. For facilitating the structural interpretation of the PRE data, the positions of the O4 atoms of the U6 residue within the NMR bundle of hnRNP A1 RRM1 bound to 5´-UUAGGUC-3´ (this study) are shown as pink spheres. The spin label attached to the 4-thio-U in the modified ISS-N1 should sample the space around this approximate position. (top) front view. (bottom) 180 ° rotation, back view. (E) Schematic representation of hnRNP A1 RRMs binding to the modified ISS-N1-u25g RNA. RRM2 is in red, and RRM1 in blue. RRM2 binds the 5´ motif and accommodates three nucleotides (CAG), with the AG dinucleotide being stacked onto F108 and F150 of the RNP2 and RNP1 motifs, respectively. RRM1 binds the 3´ motif and accommodates four nucleotides (AAGG), with the central AG dinucleotide being stacked onto F17 and F59 of the RNP2 and RNP1 motifs, respectively. (F) Structural model of the ISS-N1-u25g bound to UP1-R140A. Modeling was performed as described in the Appendix 2. RRM2 is in red, RRM1 in blue, and the inter-RRM linker in green. The ISS-N1-u25g RNA is in yellow. Some nucleotides are labeled in order to appreciate the path of the RNA on the RRMs. Please note that the path of the RNA-spacer between the 5´ and 3´ motifs is not restrained by experimental constraints. The present structural model therefore illustrates one possible path of the ISS-N1 on the RRMs and should not be seen as the unique conformation adopted by the RNA spacer.

DOI: http://dx.doi.org/10.7554/eLife.25736.018

Figure 4.

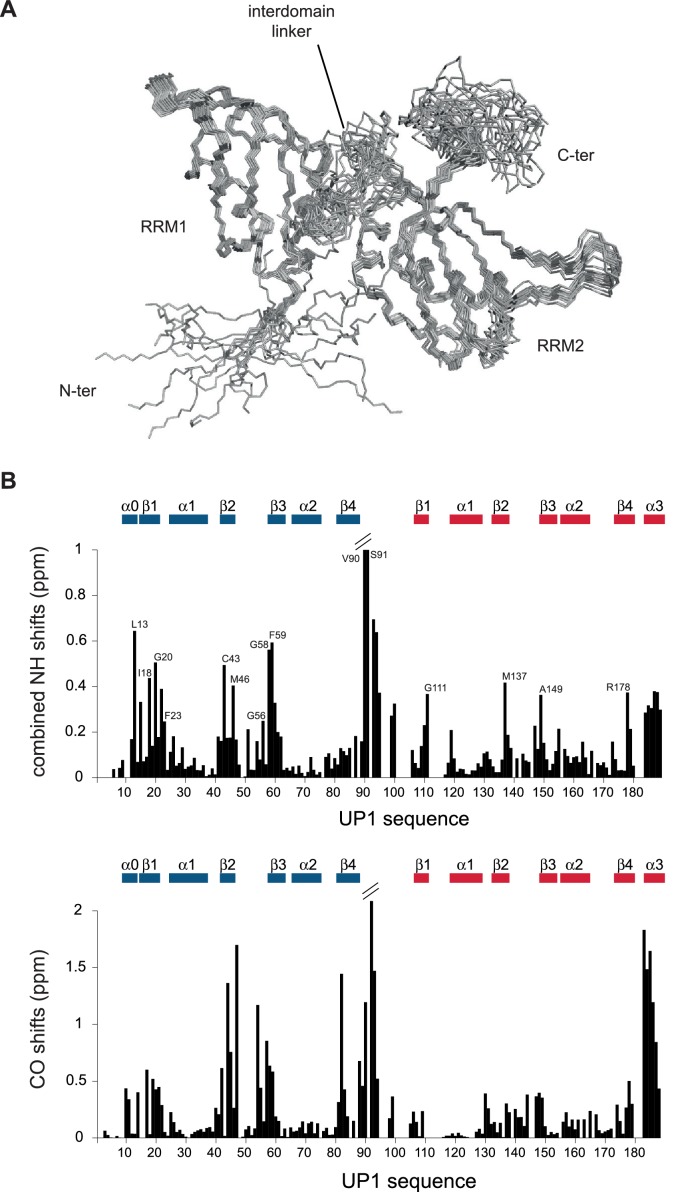
Figure 4—figure supplement 1. UP1 structure and chemical shift perturbation upon binding to the ISS-N1 RNA.

Figure 4—figure supplement 1.

(A) Structure of the UP1-R140A protein variant in its bound form to the ISS-N1-u25g variant. The bundle represents the 20 structures with the lowest violation energy. The structures were calculated with 92% proton assignment and 4261 NOE-derived distance restraints. RRM1, RRM2, and the inter-RRM linker are labeled. (B) Chemical shift perturbation of the UP1-R140A protein resonances upon binding to the ISS-N1-u25g variant. (top) Backbone amide chemical shift difference. Some residues with the largest shifts are labeled on the histogram. (bottom) Backbone carbonyl chemical shift difference. Secondary structure elements are illustrated above the histograms.
Figure 4—figure supplement 2. Summary of the intermolecular NOE between the ISS-N1-u25g RNA and the phenylalanine residues of the RNP1/RNP2 motifs of hnRNP A1 RRM1.

Figure 4—figure supplement 2.

Part of the F2-filtered 2D-(1H,1H)-NOESY. The horizontal dimension is 13C-filtered such as only the resonances from the unlabeled RNA appear. The vertical dimension is not filtered, meaning both the RNA and the protein resonances appear. Resonances from the RNA are labeled above the spectrum, with aromatic H8 protons in pink, aromatic H2 protons in red and anomeric H1´ protons in yellow. The intra-residue H8 to H1´ correlations are marked with a black cross in the aromatic/anomeric region. Resonances from the phenylalanines of the RNP1/RNP2 motifs of RRM1 (i.e. F17/F57/F59) are labeled on the right side of the spectrum. Intermolecular NOEs between these aromatics and the RNA are marked with a black cross and labeled on the spectrum.
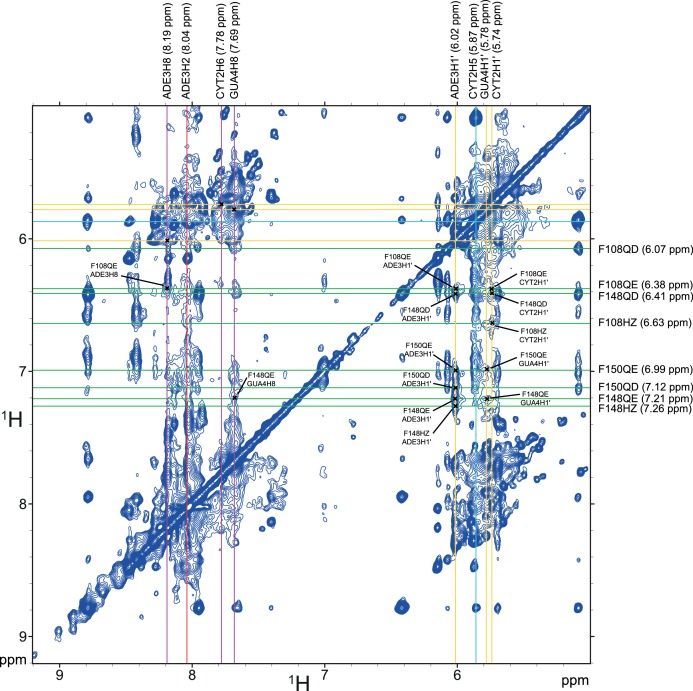
Figure 4—figure supplement 3. Summary of the intermolecular NOE between the ISS-N1-u25g RNA and the phenylalanine residues of the RNP1/RNP2 motifs of hnRNP A1 RRM2.

Figure 4—figure supplement 3.

Part of the F2-filtered 2D-(1H,1H)-NOESY. The horizontal dimension is 13C-filtered such as only the resonances from the unlabeled RNA appear. The vertical dimension is not filtered, meaning both the RNA and the protein resonances appear. Resonances from the RNA are labeled above the spectrum, with aromatic H8 and H6 protons in pink, aromatic H2 protons in red, aromatic H5 protons in cyan and anomeric H1´ protons in yellow. The intra-residue H8/H6 to H1´ correlations are marked with a black cross in the aromatic/anomeric region. Resonances from the phenylalanines of the RNP1/RNP2 motifs of RRM2 (i.e. F108/F148/F150) are labeled on the right side of the spectrum. Intermolecular NOEs between these aromatics and the RNA are marked with a black cross and labeled on the spectrum.