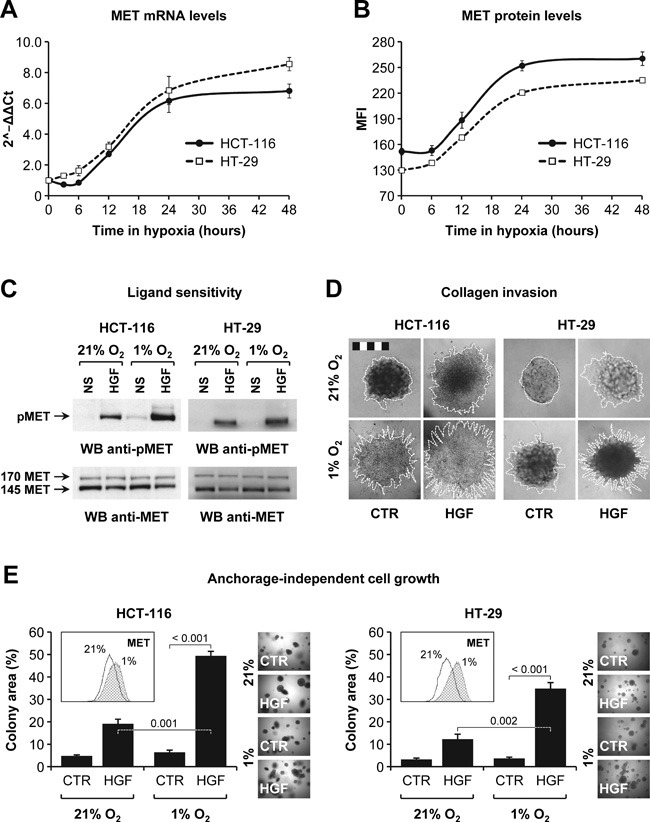
Figure 5. HGF sustains colorectal cancer cell invasion in hypoxic conditions.

A. MET mRNA levels in HCT-116 and HT-29 cells incubated in hypoxia (1% O2) were determined by RT-PCR. Data are expressed as 2−∆ ∆ Ct compared to time zero. B. MET protein expression levels in HCT-116 and HT-29 cells incubated in hypoxia (1% O2) were determined by flow cytometry. MFI, mean fluorescence intensity. C. HCT-116 and HT-29 cells were pre-conditioned in 21% or 1% O2 and then stimulated with HGF. Phospho-MET (pMET) and total MET (MET) levels were determined by Western blotting (WB). NS, not stimulated. The upper 170 kDa MET band corresponds to the uncleaved, immature precursor. D. Collagen invasion by HCT-116 and HT-29 cells was determined in 21% or 1% O2 and in the absence or presence of HGF. Branching morphogenesis was analyzed by microscopy. Colony contour is highlighted with a white dotted line. Bar size: 500 μm. E. Anchorage-independent growth of HCT-116 and HT-29 cells pre-conditioned in 21% or 1% O2 was examined in a soft agar assay conducted in normoxia and in the absence or presence of HGF. Cells pre-conditioned in 1% O2 expressed higher levels of MET protein (see FACS inset). Values represent mean ± SEM. Statistical significance was calculated using a Student's T-test (n = 3).
