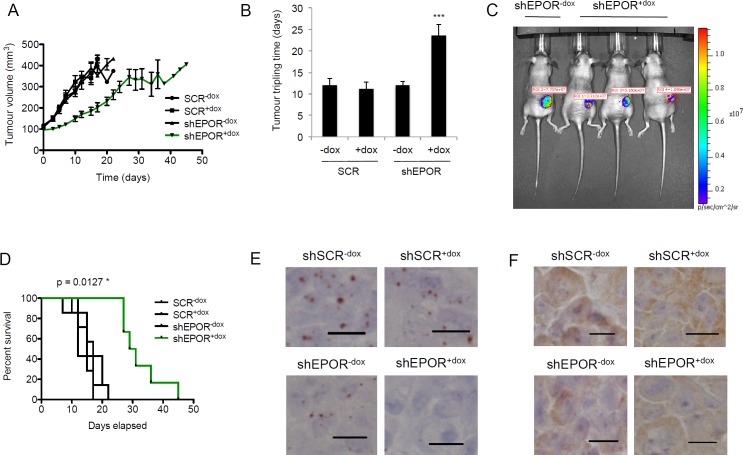
Figure 5. Effect of EPOR knockdown on breast tumor growth.
in vivo. A. Tumor volume measurements of mice in the four subgroups, shSCR−dox (n = 7), shSCR+dox (n = 7), shEPOR−dox (n = 7) and shEPOR+dox (n = 6), following the commencement of doxycycline and EPO treatment at 100 mm3 tumor volume. B. Tumor tripling time in days for the tumor to grow from 100 mm3 to 300 mm3. ***p < 0.0001 for shEPOR+dox vs shSCR−dox; shEPOR+dox vs shSCR+dox; shEPOR+dox vs shEPOR−dox; and shEPOR+dox vs shEPOR−dox, Bonferroni's Multiple Comparison Test. All other comparisons between subgroups were non-significant (NS). C. In Vivo Imaging System (IVIS) time-matched images of one shEPOR−dox mouse (left lane) and three shEPOR+dox mice on Day 15. D. Kaplan-Meier plot of the survival time in shSCR−dox, shSCR+dox, shEPOR−dox and shEPOR+dox animals. Mice were culled when the tumor volume reached 400 mm3; *p = 0.0127, log-rank (Mantel-Cox) test. E. RNAscope® analysis of EPOR expression in representative tumors from shSCR−dox, shSCR+dox, shEPOR−dox and shEPOR+dox mice. Scale bar represents 10 μm. F. Immunohistochemical analysis of EPOR expression, using the anti-EPOR antibody GM1201, in representative tumors from shSCR−dox, shSCR+dox, shEPOR−dox and shEPOR+dox mice. Images were taken at x40 magnification. Scale bar represents 10 μm.

