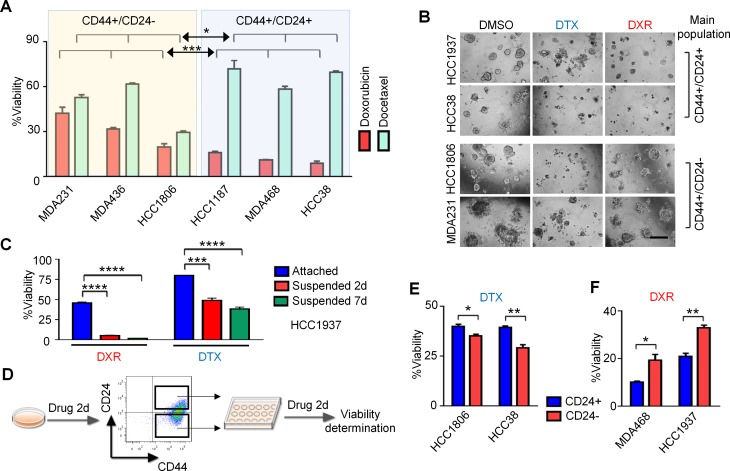
Figure 2. CD24+/high TNBC cells are resistant to docetaxel (DTX) and CD24−/low TNBC cells are resistant to doxorubicin (DXR).
(A) The drug sensitivity assay results of six TNBC cell lines dosed with either 25.6 μM docetaxel or 6.4 μM doxorubicin are shown. P-values were calculated with Two-way ANOVA. *P < 0.05; ***P < 0.001. (B) After seeding in matrigel for 4 days, cells were treated with 0.6 μM docetaxel or 60 nM doxorubicin for 7 days. (C) HCC1937 cells were cultured under standard conditions or in ultralow-attachment plates for 2 days, then treated with 6 μΜ doxorubicin or 25.6 μΜ docetaxel for either 2- or 7 days. ***P < 0.001; ****P < 0.0001. (D) Work flow for experiments shown in (E) and (F). HCC1806 and HCC38 cells were treated with 25.6 μM docetaxel for 2-days. Treated cells were then sorted into CD44+/CD24+/high and CD44+/CD24−/low populations by FACS. Sorted populations were re-treated with 25.6 μM docetaxel, with cell viabilities determined after 2-days. MDA-MB-468 and HCC1937 cells underwent the same protocol except 6.4 μM doxorubicin was used. (E) and (F) P-values were calculated with unpaired t test. *P < 0.05; **P < 0.01. Error bars represent SEM. Scale bar, 200 μm.

