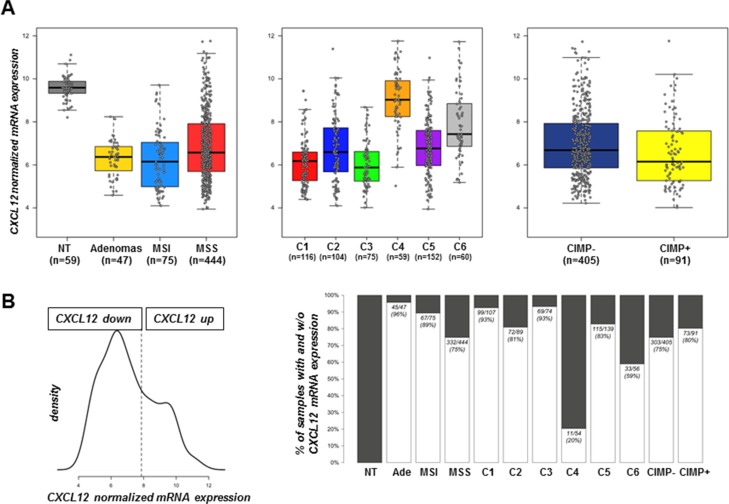
Figure 1. CXCL12 mRNA expression distribution.
(A) Boxplot of intensity values according to sample types (left) (47 adenomas, 75 MSI carcinomas, 444 MSS carcinomas, and 59 non-tumor tissues), colon cancer subtype (middle) (n = 566 MSS and MSI carcinomas of the discovery set) and CIMP status (right) (n = 496). (B) Distribution and discretization of CXCL12 expression established from 702 samples, including the 566 samples (19), 30 carcinomas from the GSE4183 data set, the 59 non-tumor tissues and 47 carcinomas of undefined phenotype. (Left) Density estimation of CXCL12 expression value with mclust approach defining two distinct distributions that correspond to a cut-off value of 7.8. (Right) Proportion of the defined discretization of CXCL12 expression within sample type, colon cancer subtype and CIMP status groups. Black boxes indicate % of samples not expressing CXCL12 mRNA; white boxes indicate the % of samples expressing CXCL12 mRNA.

