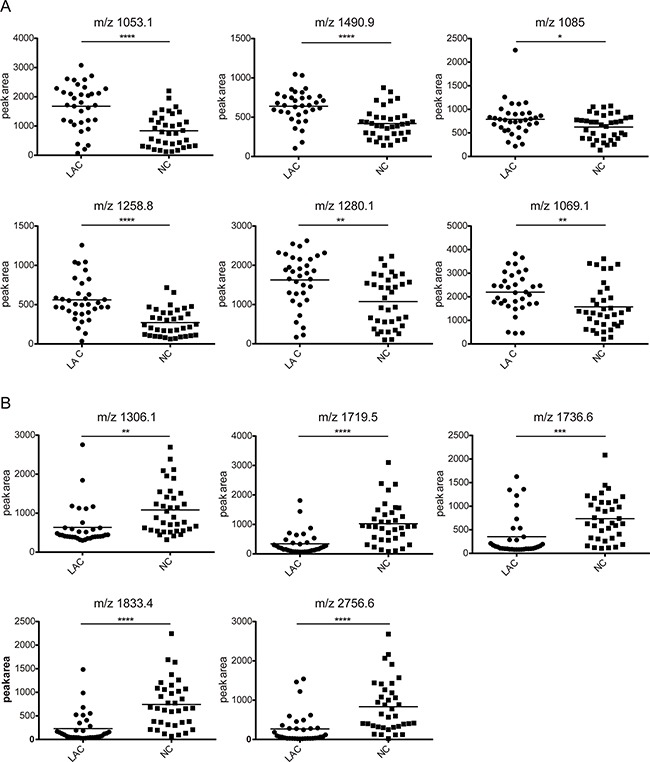
Figure 4. The feature of the 11 selected peaks in lung adenocarcinoma and health control.

The peak area distributions in all samples. A. The average value showing an increasing trend in lung adenocarcinoma group compared with normal control group. B. The average value showing a decreasing trend in lung adenocarcinoma group compared with normal control group. *P<0.05, **P<0.01, ***P<0.001, ****P<0.0001.
